
5 Awesome Grafana Alternatives
 Yulei Chen
Grafana is the go-to open-source platform for dashboards, metrics, and observability. It connects to virtually any data source and powers monitoring setups at companies of all sizes. But Grafana Cloud pricing can add up quickly — the Pro plan starts at $19/month as a platform fee, plus usage-based charges for metrics ($6.50/1k series), logs ($0.50/GB), and $8/active user for visualization alone ($55 with Enterprise plugins).
The good news? You can self-host Grafana OSS for just €9 per month with Sliplane — one click, no server management needed. Check out our easy deploy guide to get started in minutes.
But maybe Grafana isn't quite the right fit for your use case. Maybe you need something more business-analytics focused, or a lighter-weight monitoring tool, or an all-in-one observability platform. Let's look at 5 awesome alternatives!
1. Metabase
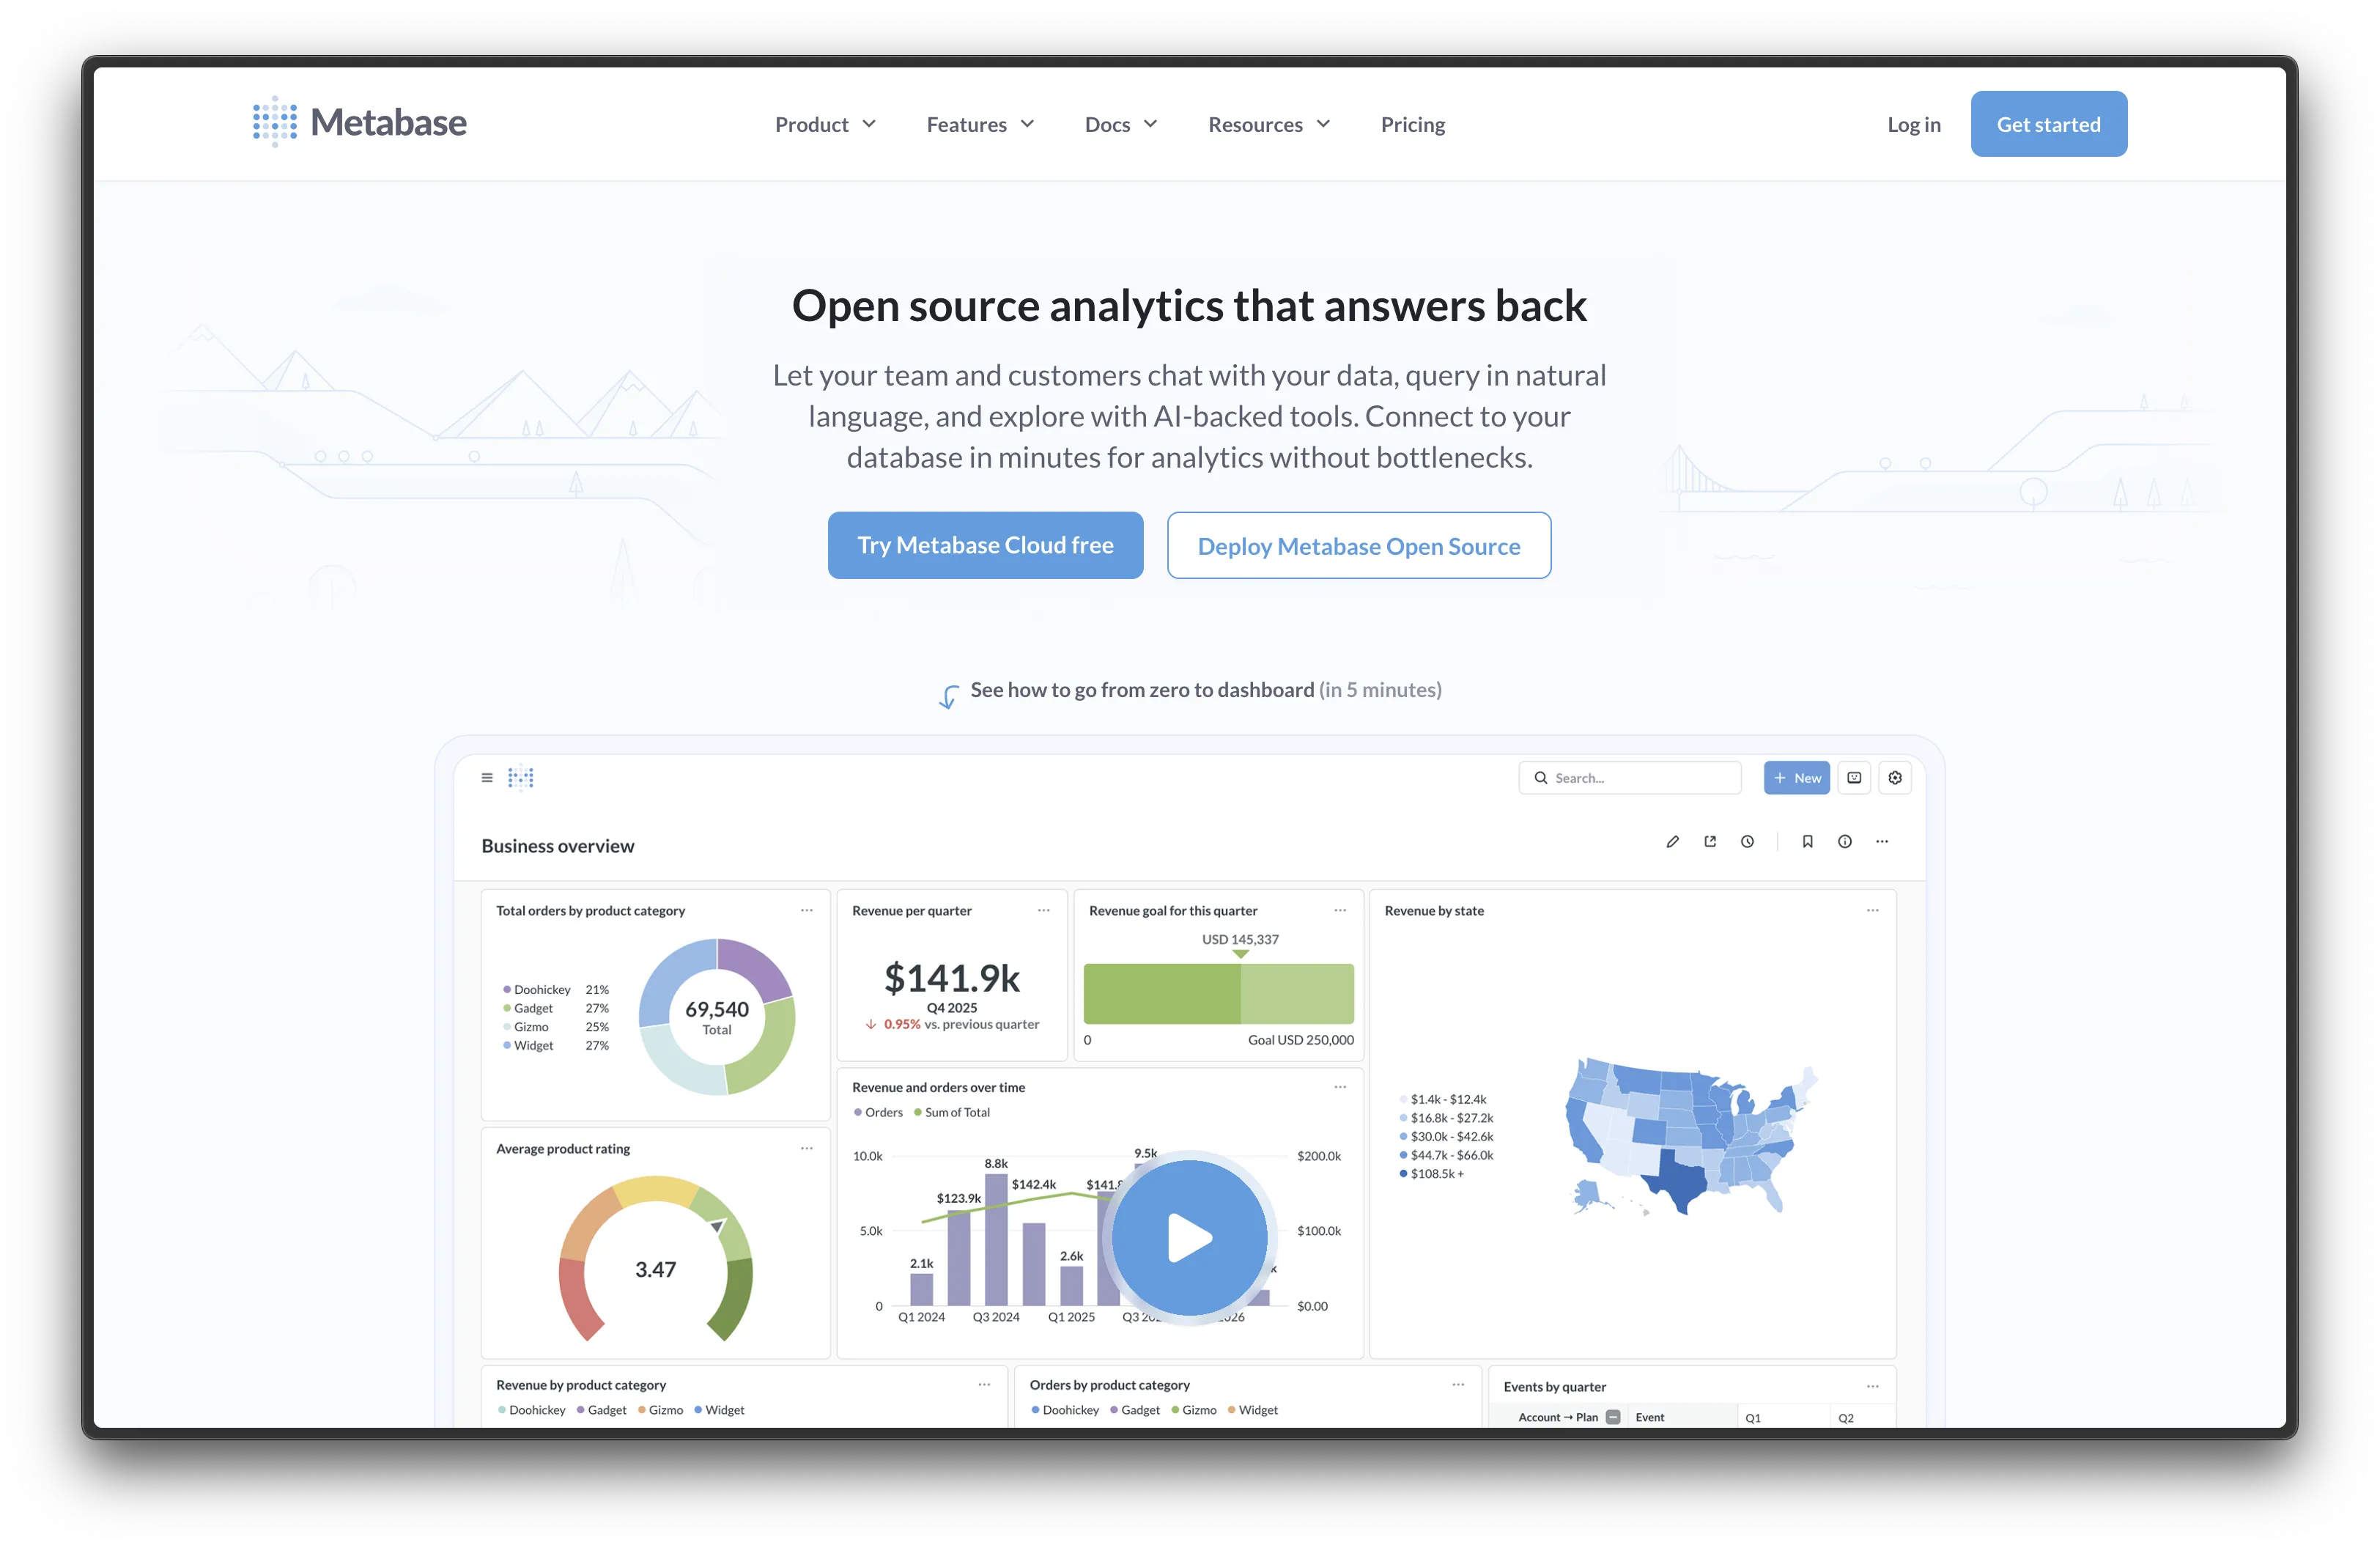
Metabase is one of the most popular open-source BI tools with over 40,000 GitHub stars. While Grafana excels at time-series metrics and infrastructure monitoring, Metabase shines at business analytics — letting non-technical users build dashboards without writing SQL.
- Features: Visual query builder (no SQL needed), interactive dashboards, embedded analytics, 20+ data source connectors, alerting, scheduled reports, and a powerful SQL editor for advanced users.
- Why You Should Use It: If your use case is more business intelligence than infrastructure monitoring, Metabase is hard to beat. The visual query builder means anyone on your team can explore data and build dashboards, not just engineers. It's also much easier to set up than Grafana for straightforward database analytics.
- Why Not: Metabase isn't designed for time-series metrics, log analysis, or infrastructure monitoring. If you need to monitor server health, application traces, or Prometheus metrics, Grafana is the better choice.
- Pricing: Free (open-source, AGPL); Metabase Cloud starts at €85/month for 5 users. Self-hosting the open-source version is free.
We have a detailed comparison of Metabase alternatives if you want to explore the BI space further. And if you want to try it out, you can self-host Metabase on Sliplane for €9/month.
2. Kibana
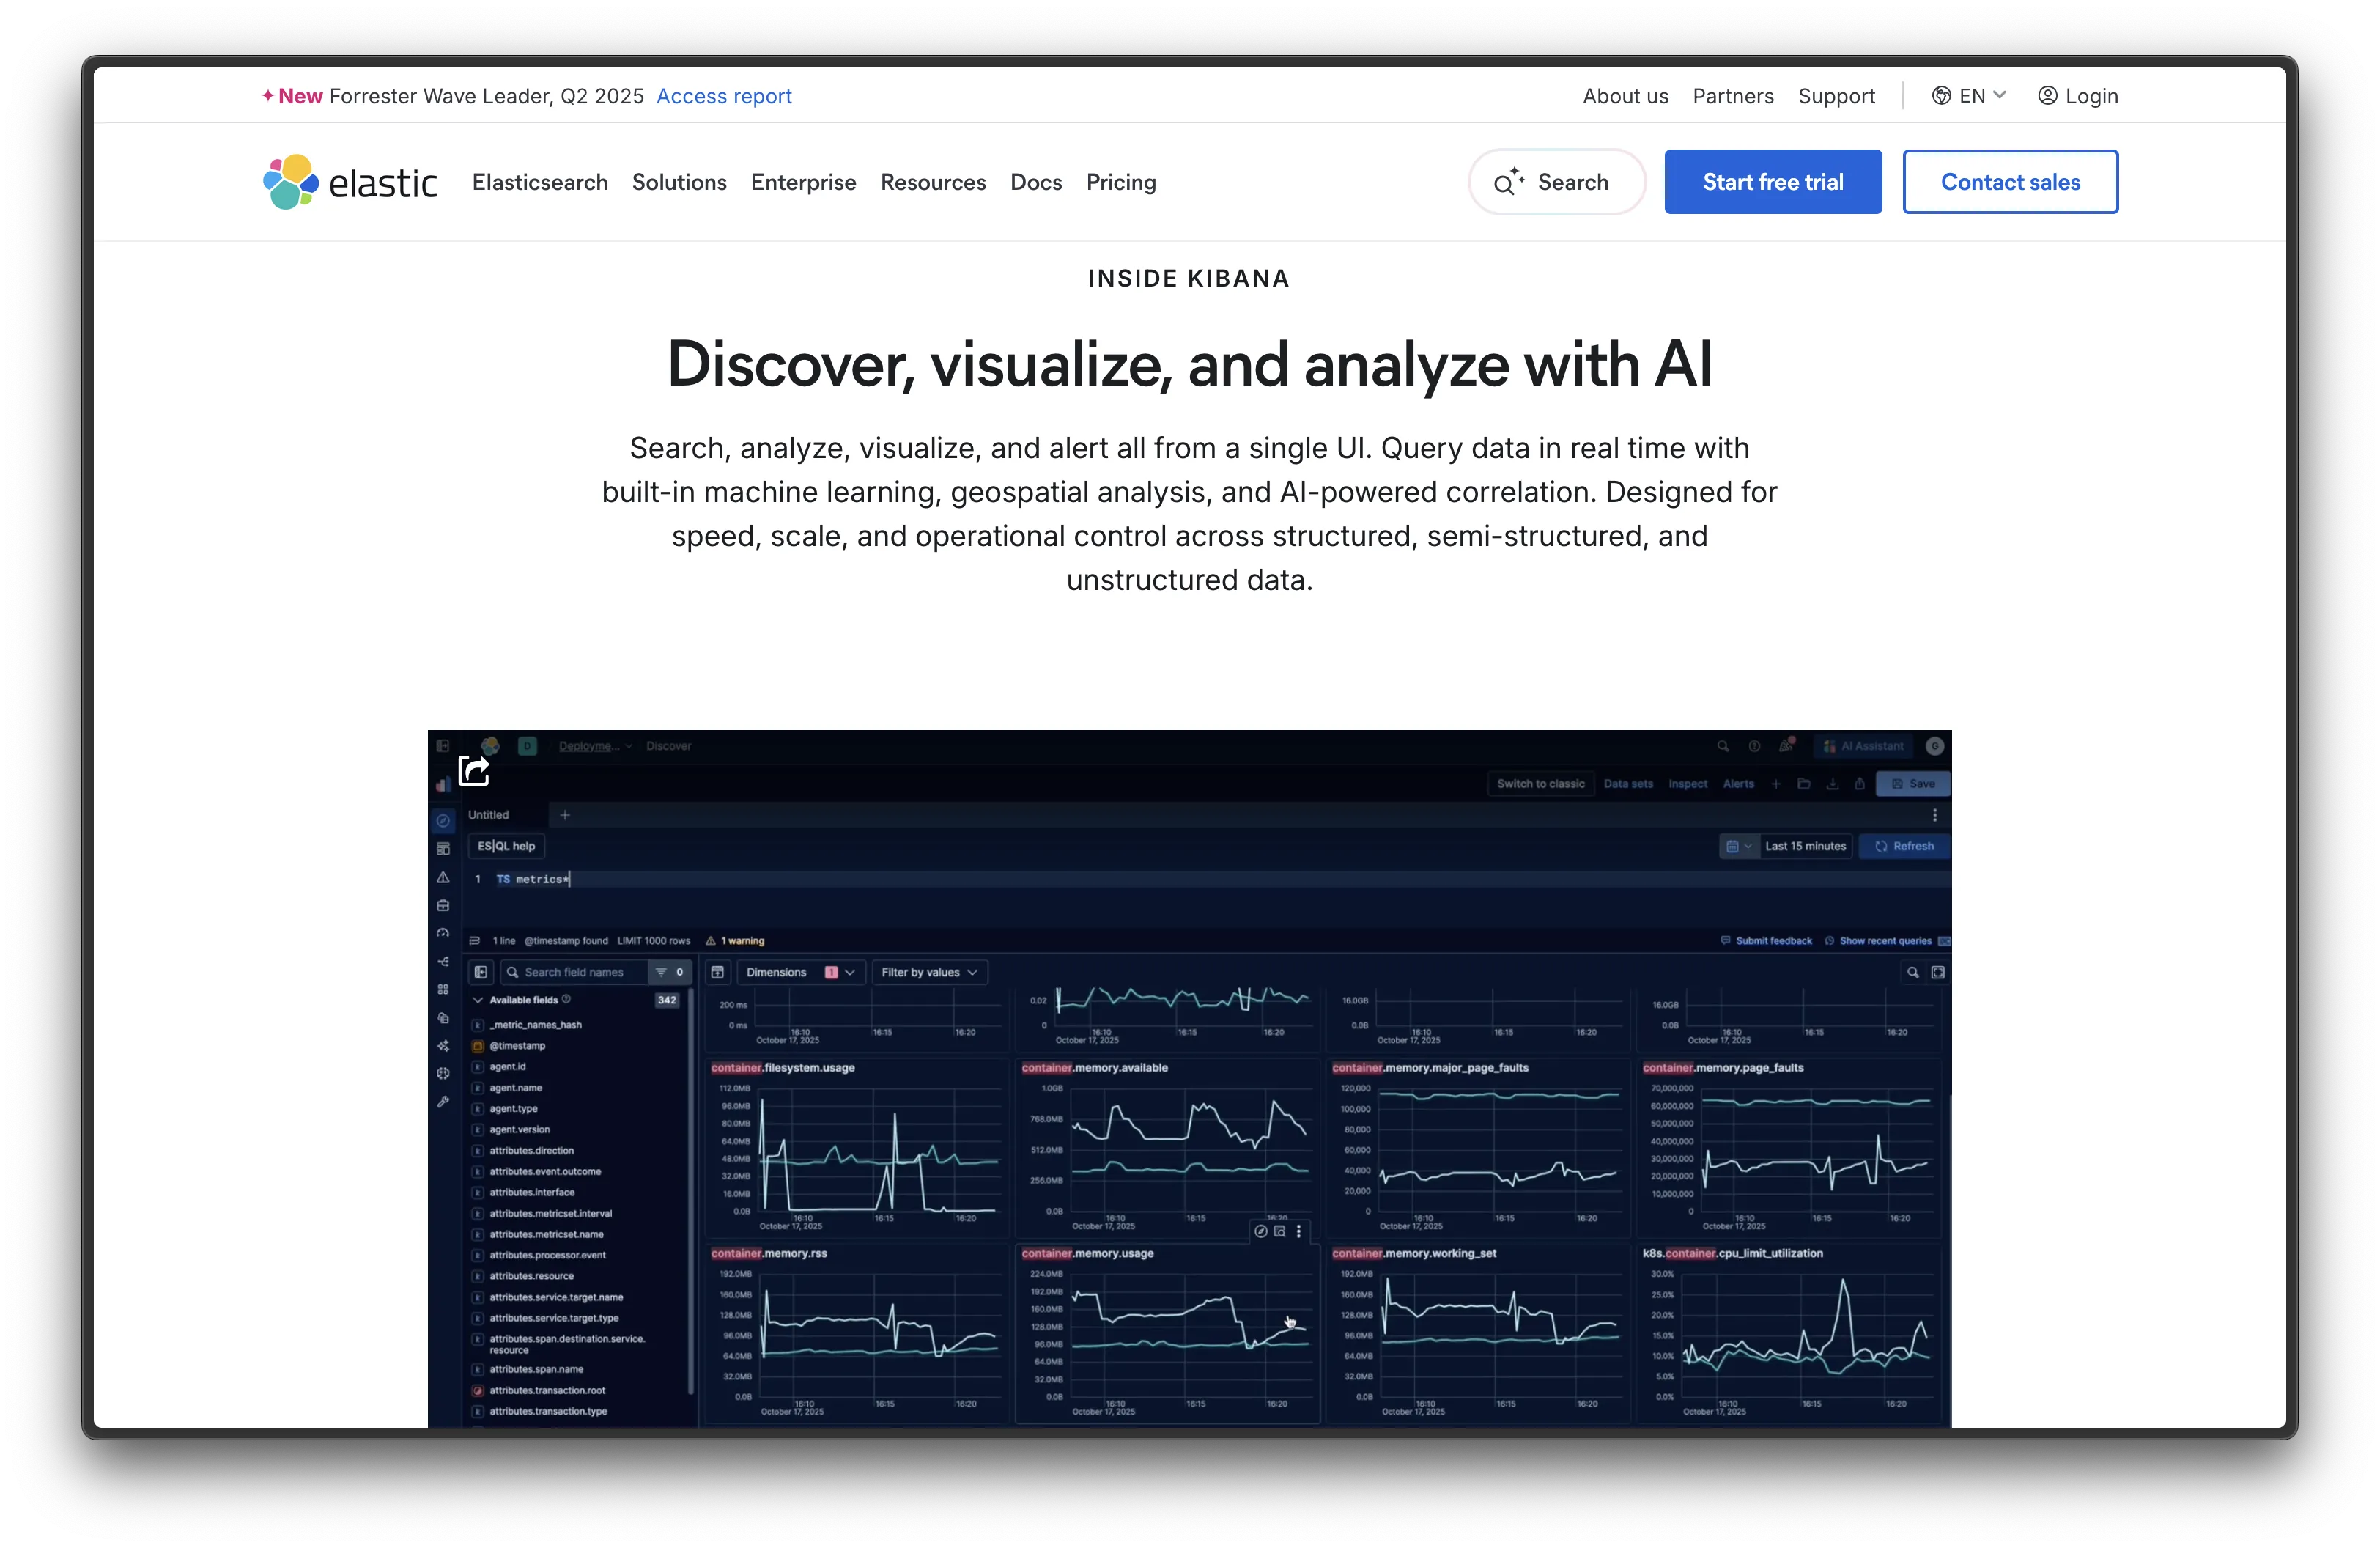
Kibana is the visualization layer of the Elastic Stack (ELK — Elasticsearch, Logstash, Kibana). It's a natural alternative to Grafana if your primary focus is log analysis and search.
- Features: Log Explorer, full-text search powered by Elasticsearch, APM and distributed tracing, security analytics (SIEM), machine learning anomaly detection, Canvas for pixel-perfect dashboards, and Lens for drag-and-drop visualizations.
- Why You Should Use It: If you're already invested in Elasticsearch or need powerful log search and analysis, Kibana is unmatched. The tight integration with the Elastic ecosystem means you get a cohesive experience across logs, metrics, traces, and security — all in one stack.
- Why Not: Kibana is tightly coupled to Elasticsearch, so you're locked into that ecosystem. Running an Elastic Stack requires significantly more resources (RAM and storage) than a standalone Grafana setup. The learning curve is also steeper.
- Pricing: Free (open-source under SSPL/Elastic License); Elastic Cloud starts at $95/month for the Standard tier. Self-hosting is free but resource-intensive.
3. Netdata
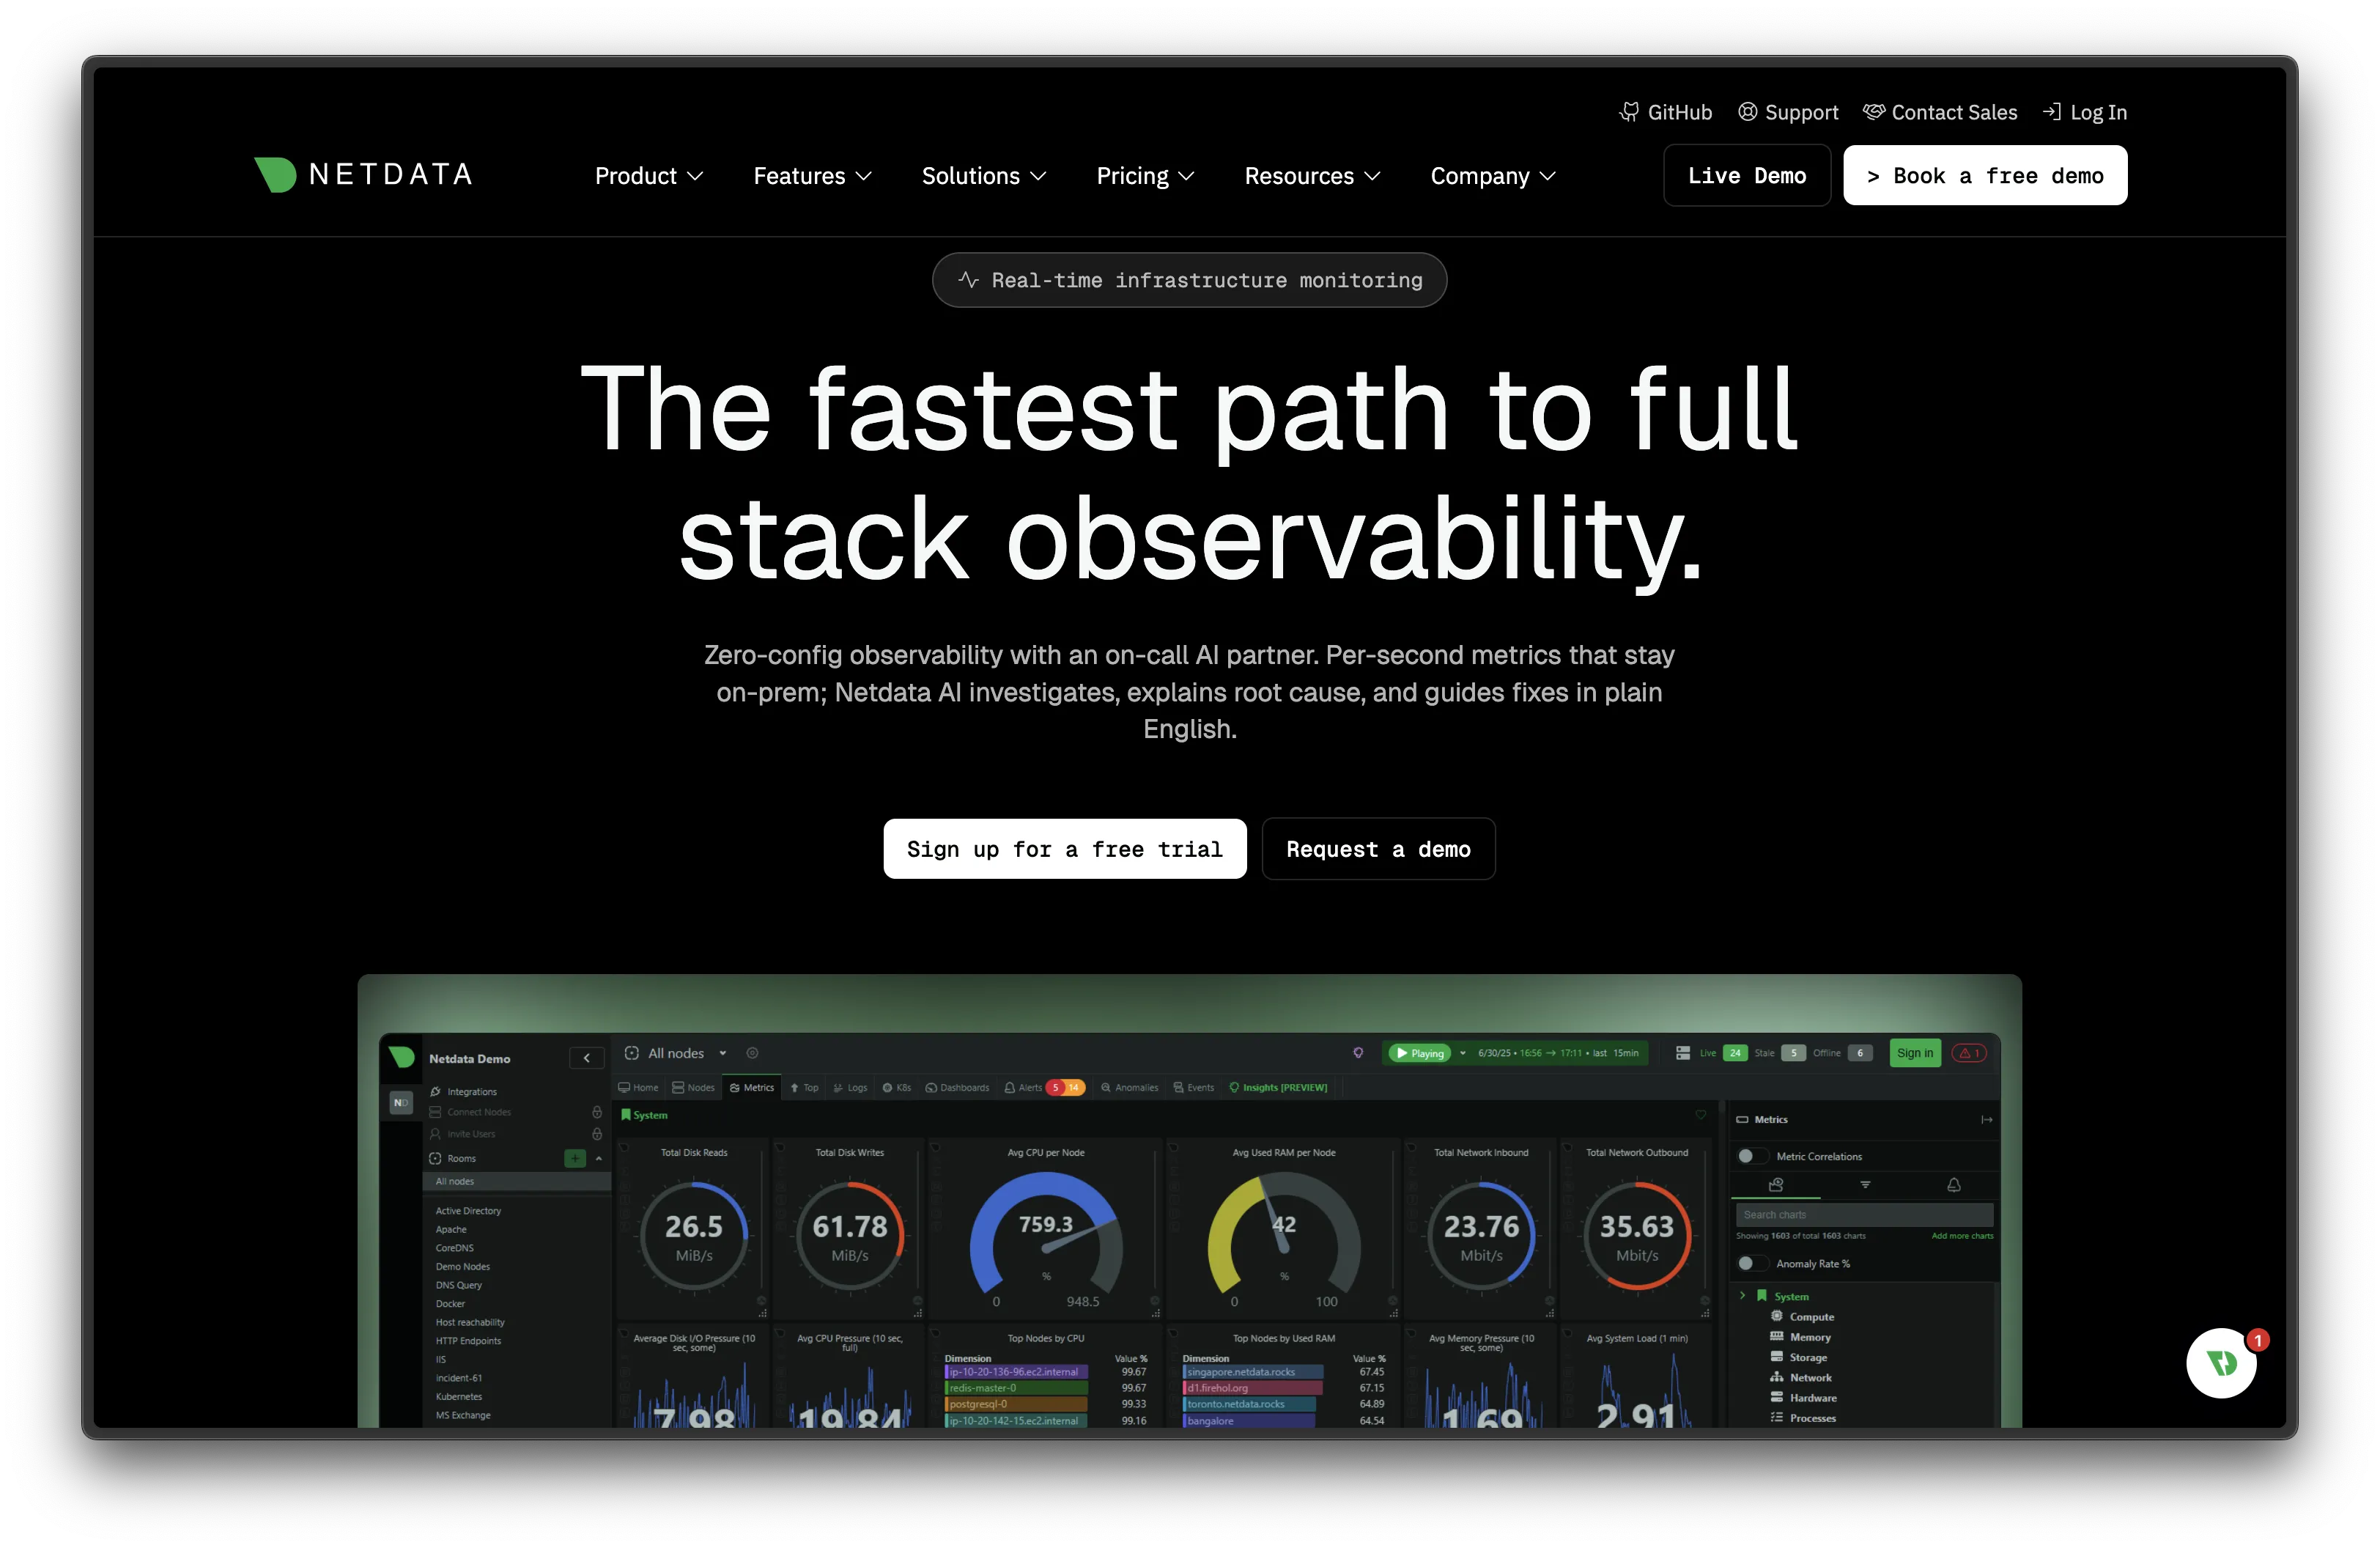
Netdata takes a completely different approach to monitoring. It's a lightweight, real-time infrastructure monitoring agent that auto-discovers everything running on your systems and creates dashboards instantly — no configuration needed.
- Features: Auto-discovery of 800+ metrics sources, per-second granularity, real-time streaming dashboards, built-in alerting with 750+ pre-configured alerts, distributed architecture, machine learning-powered anomaly detection, and extremely low resource usage (~1% CPU).
- Why You Should Use It: If you want instant infrastructure monitoring without spending hours configuring dashboards and data sources, Netdata is magic. Install the agent, and you immediately get thousands of metrics with beautiful, interactive dashboards. The per-second granularity is far more detailed than what most Grafana setups offer out of the box.
- Why Not: Netdata is focused on infrastructure and system metrics. It doesn't support the wide range of data sources Grafana connects to (like SQL databases, cloud services, or business data). It's also less customizable for building tailored business dashboards.
- Pricing: Free (open-source, GPL-3.0) for self-hosted monitoring; Netdata Cloud free tier for up to 5 nodes; Pro at $3.50/node/month; Business at $6/node/month.
4. Signoz
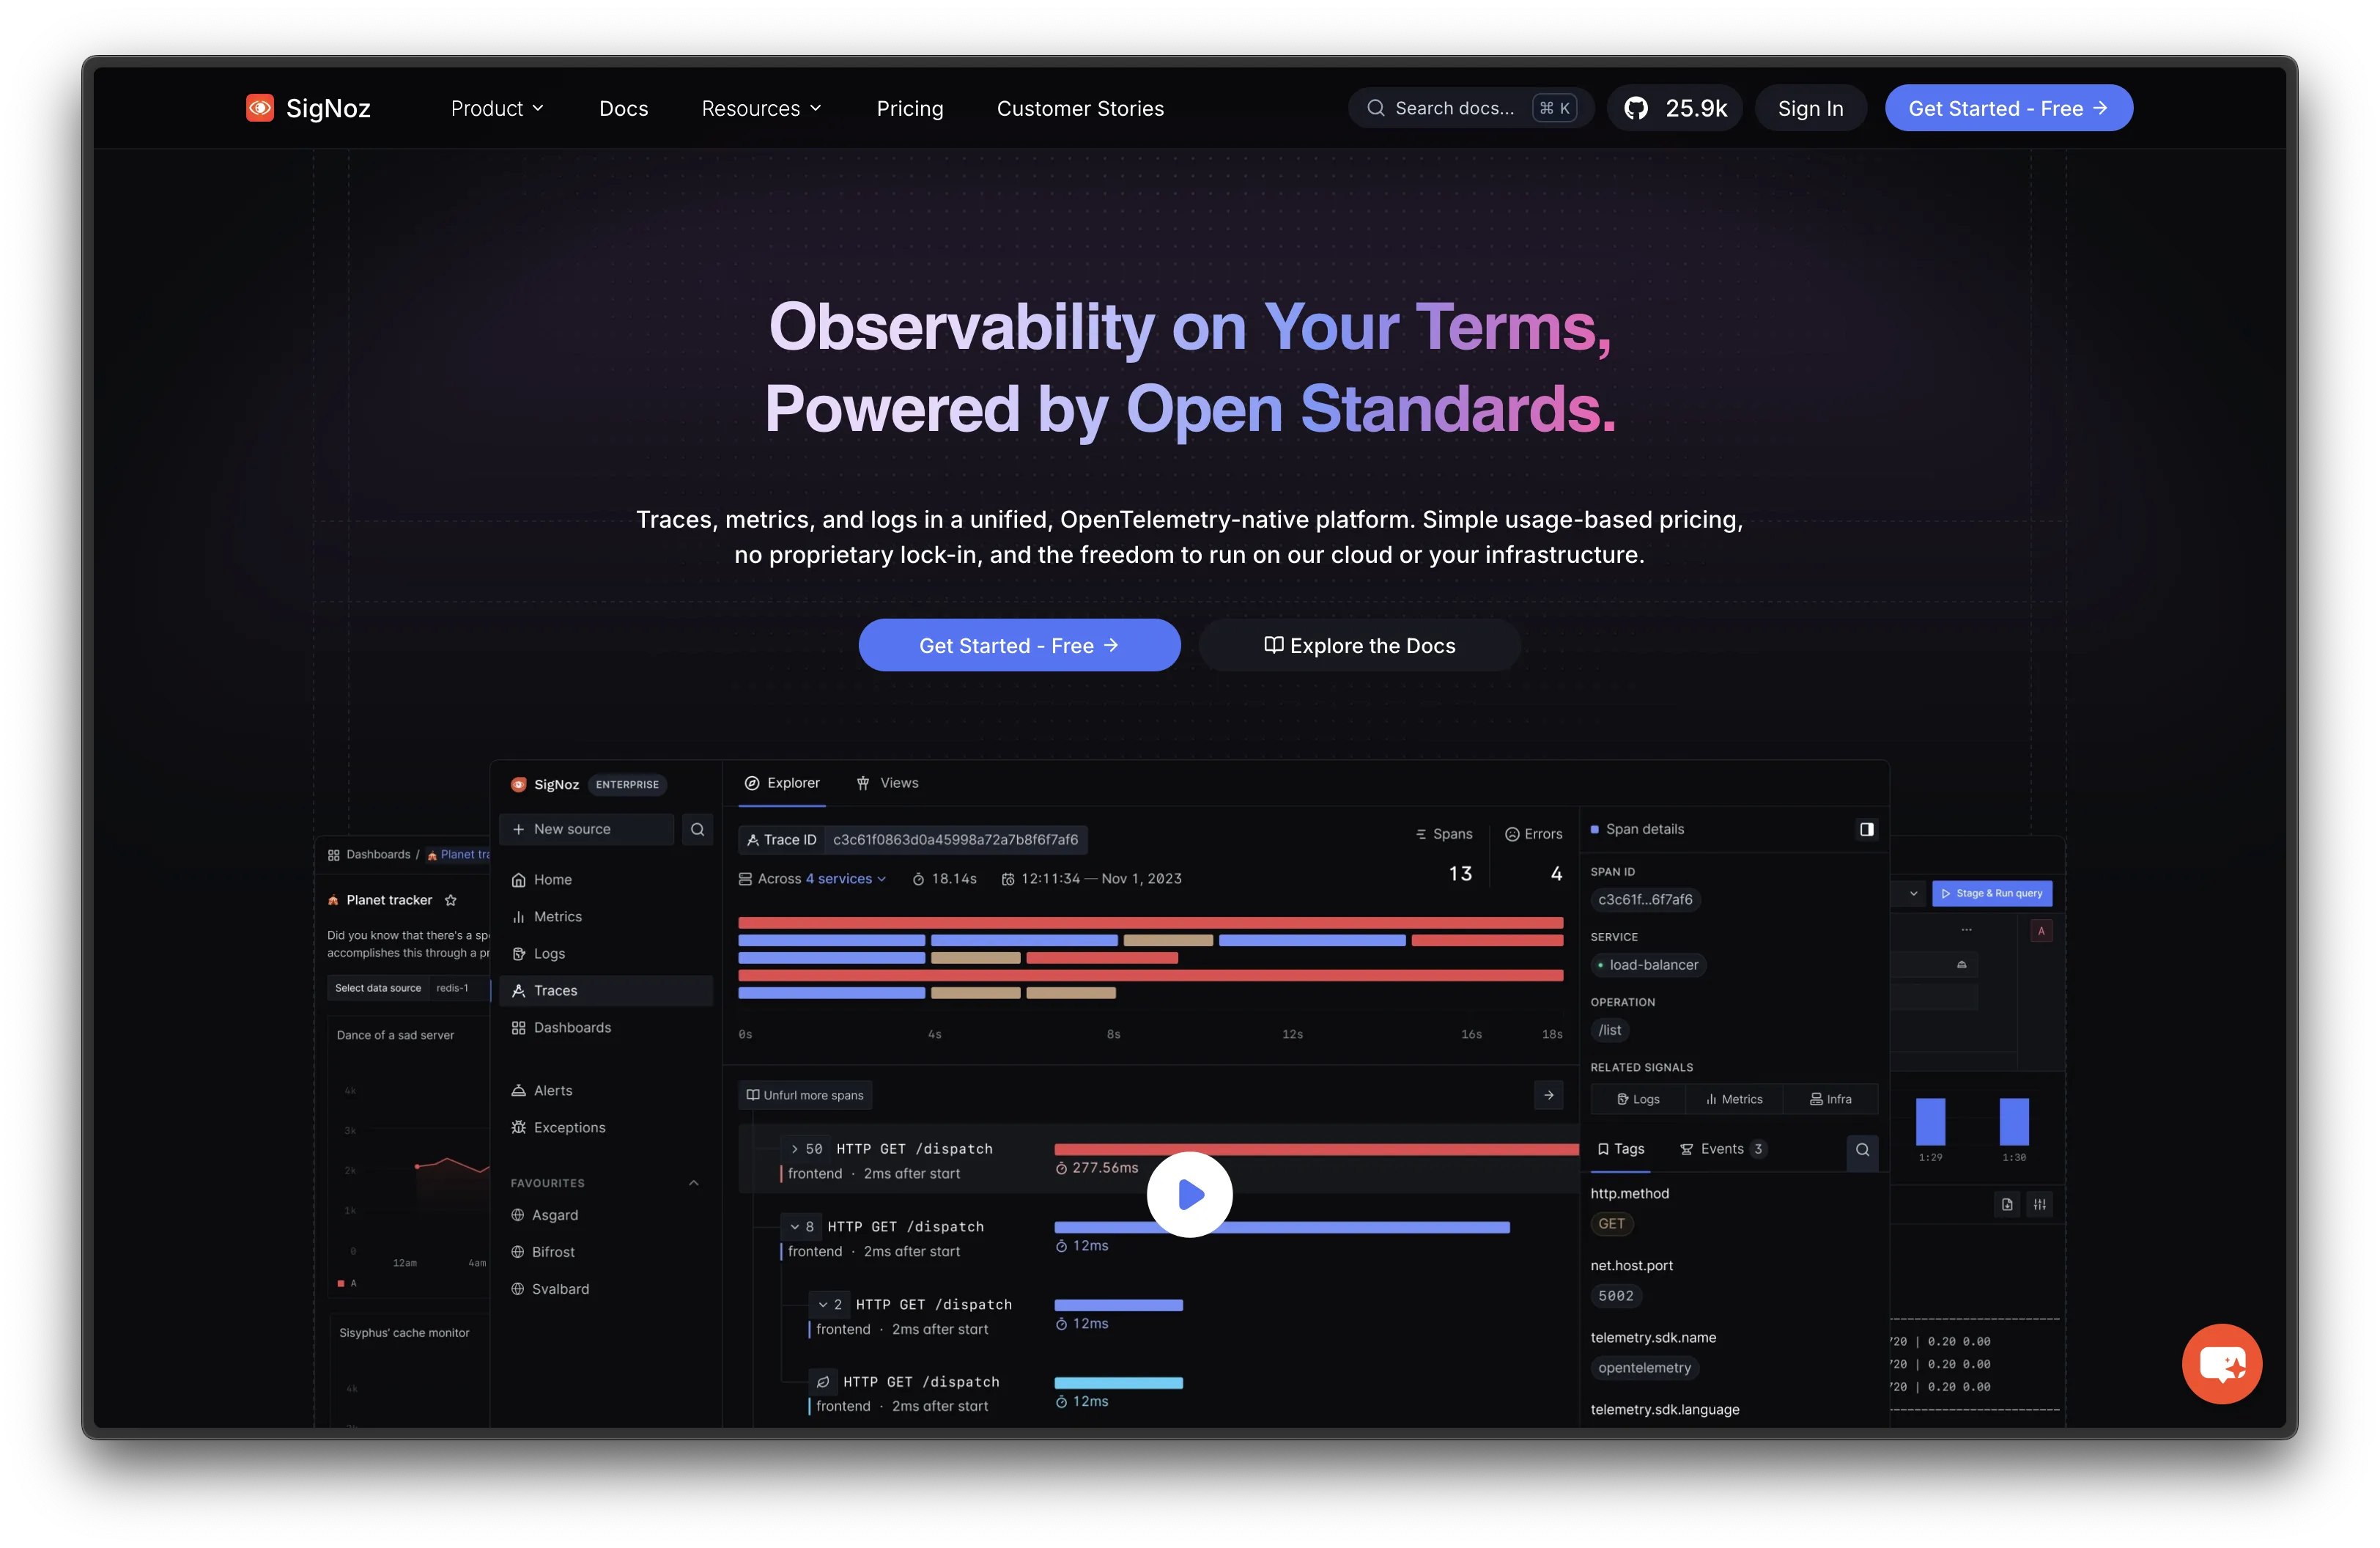
Signoz is a modern, open-source observability platform that combines metrics, traces, and logs in a single tool — essentially aiming to be an open-source alternative to Datadog.
- Features: APM with distributed tracing, metrics monitoring, log management, exceptions tracking, alerts, service maps, OpenTelemetry-native (no proprietary agents), and a ClickHouse-based storage backend for fast queries at scale.
- Why You Should Use It: If you want a unified observability platform that handles traces, metrics, and logs without stitching together multiple tools (like Grafana + Prometheus + Loki + Tempo), Signoz delivers it all in one package. Being OpenTelemetry-native means no vendor lock-in — you can switch away without re-instrumenting your apps.
- Why Not: Younger project with a smaller community than Grafana. The plugin ecosystem is limited compared to Grafana's 100+ data source plugins. Running the full stack (ClickHouse + Signoz) requires decent resources.
- Pricing: Free (open-source, MIT + Apache 2.0 for components); Signoz Cloud starts at usage-based pricing ($0.3/GB for logs, $0.1/million samples for metrics). Self-hosting is free.
5. Apache Superset
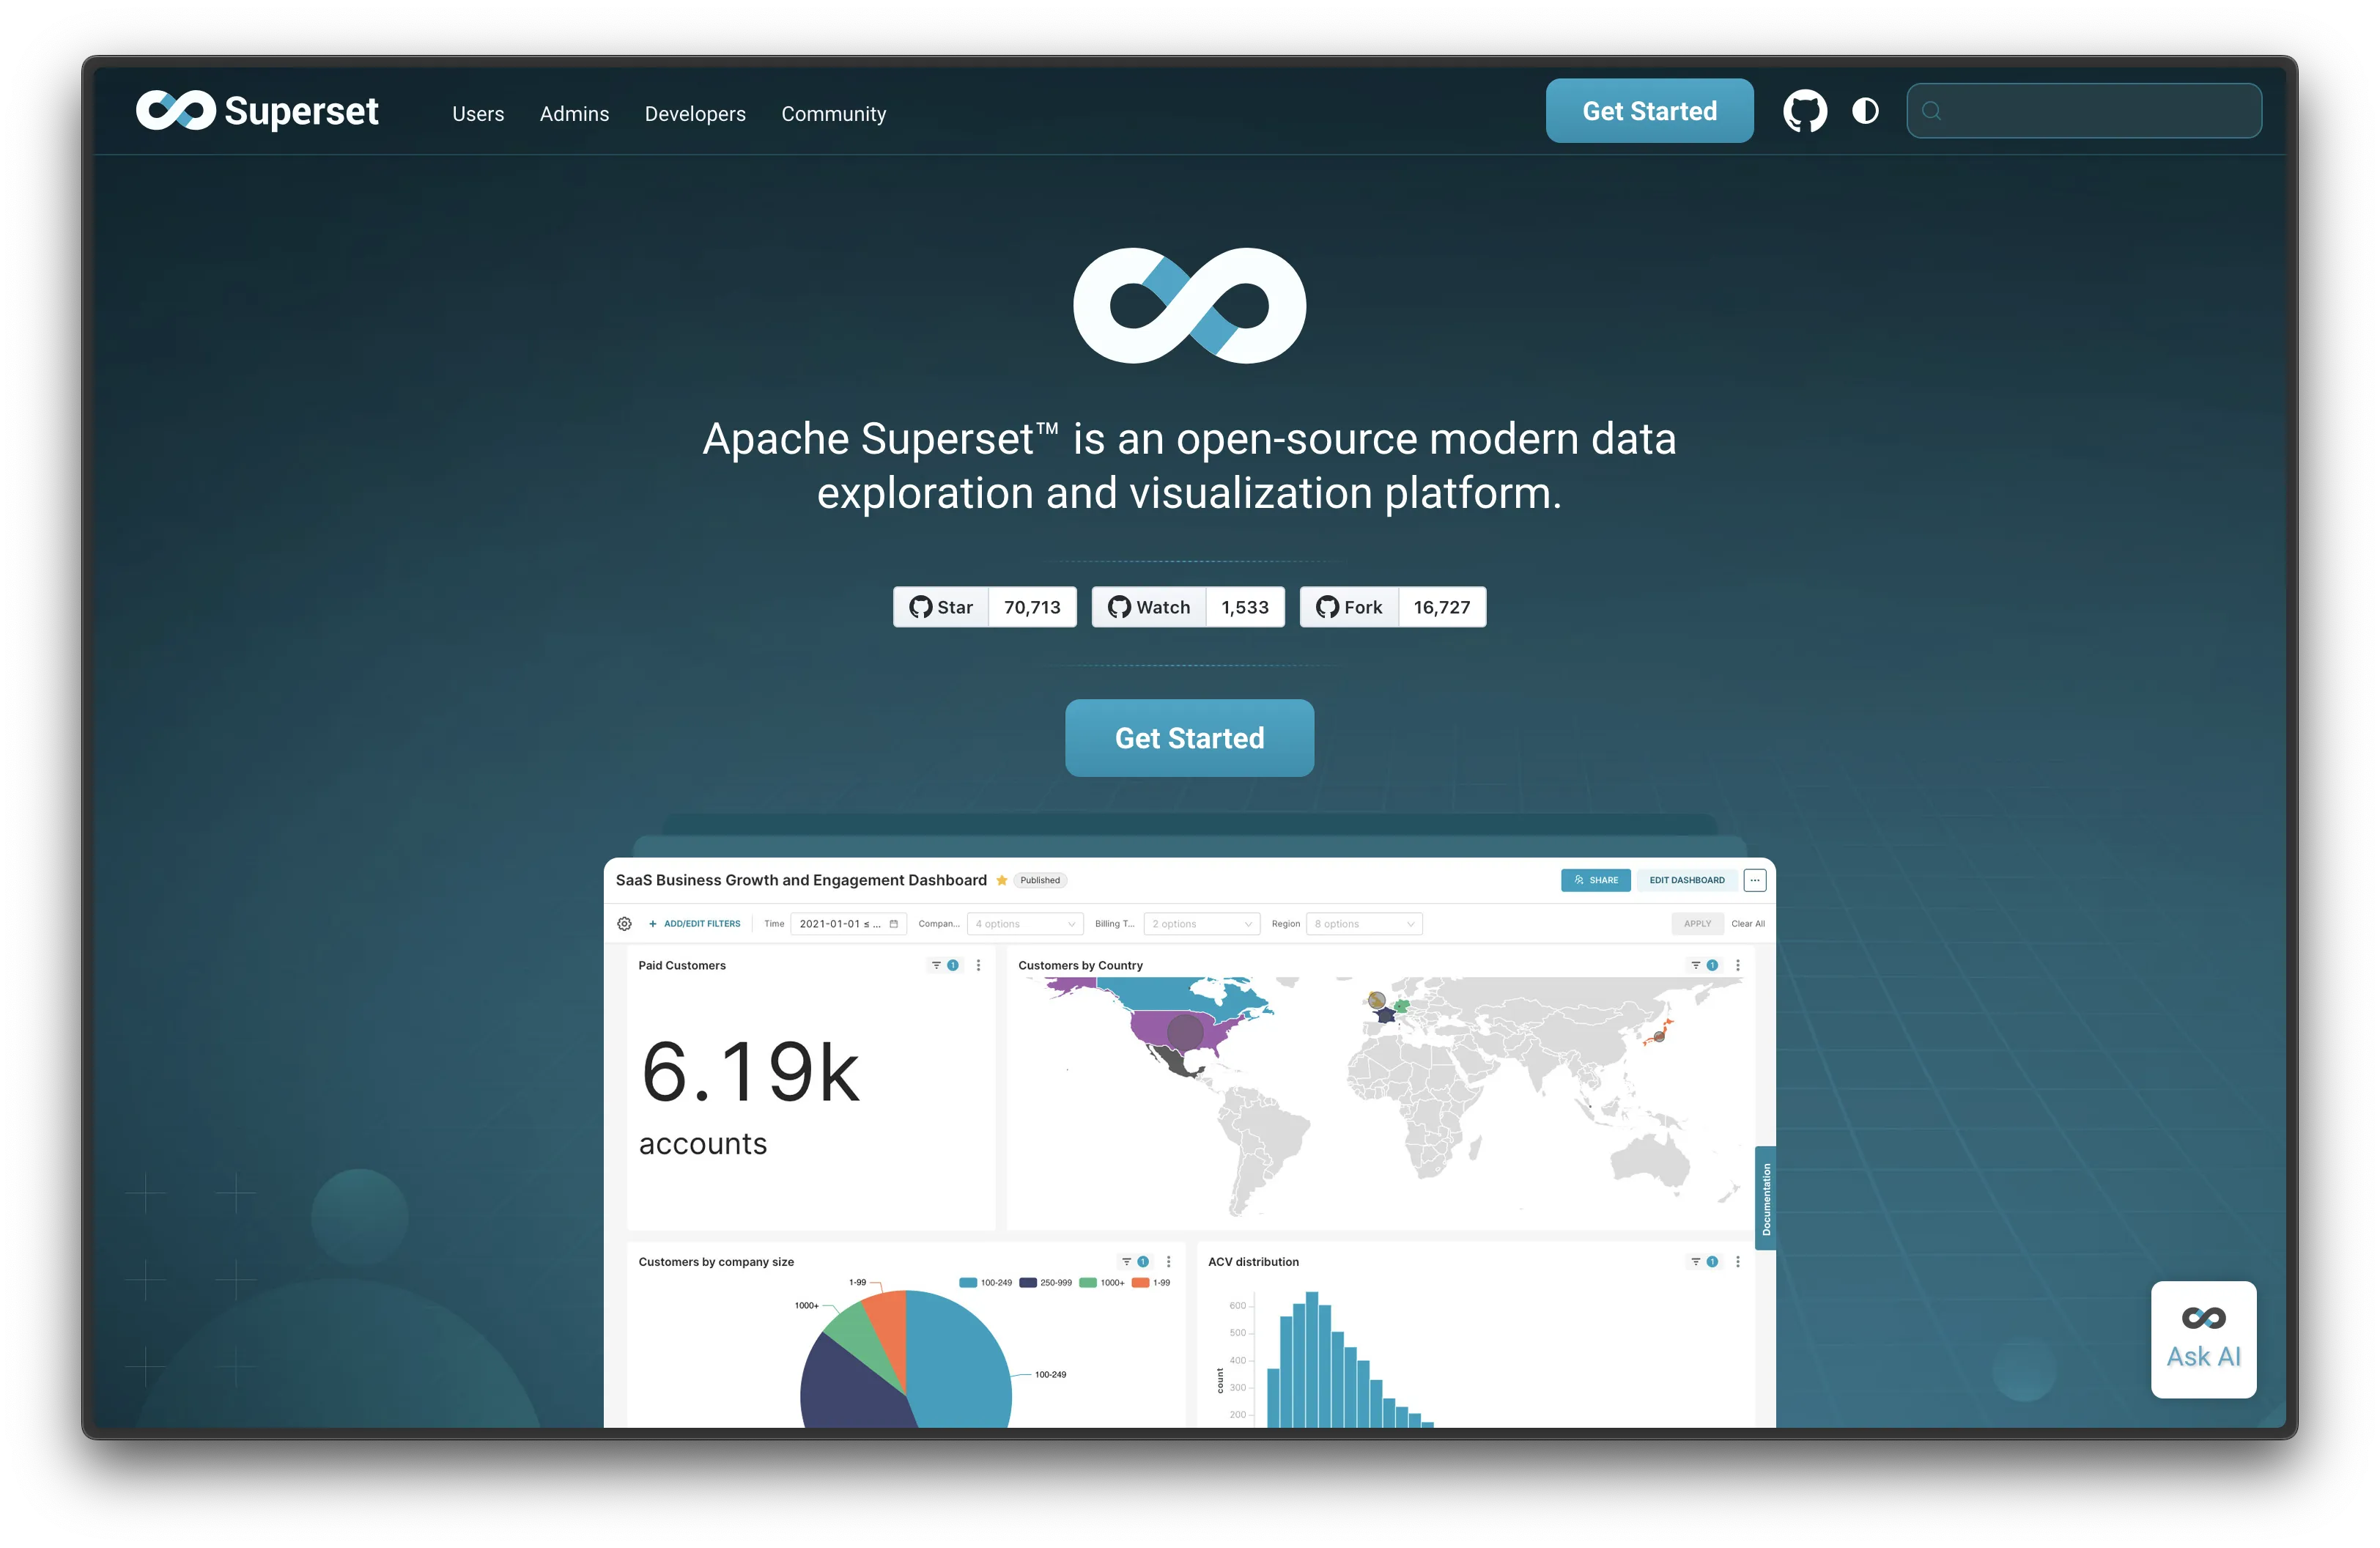
Apache Superset is a heavyweight open-source data exploration and visualization platform with over 70,000 GitHub stars. Backed by the Apache Software Foundation, it's used by companies like Airbnb, Dropbox, and Lyft.
- Features: 40+ visualization types, powerful SQL editor (SQL Lab), semantic layer for custom metrics and dimensions, row-level security, cross-filters, drill-to-detail, Jinja templating, caching, and a plugin architecture for custom visualizations.
- Why You Should Use It: If you need advanced data exploration with SQL and want a visualization library that goes far beyond what Grafana offers for business data, Superset delivers. The semantic layer lets you define reusable metrics and dimensions, and the SQL Lab is excellent for ad-hoc analysis.
- Why Not: Superset is heavier than Grafana and harder to set up. It's not designed for real-time infrastructure monitoring or time-series metrics — it's better suited for analytical queries on data warehouses. Non-technical users will need guidance.
- Pricing: Free (open-source, Apache License 2.0). Preset (managed Superset) offers cloud hosting with pricing on request.
Conclusion
| Tool | Best For | Ease of Setup | Data Focus | Cloud Pricing |
|---|---|---|---|---|
| Metabase | Business analytics, non-technical teams | Easy | SQL databases, BI | €85/mo (5 users) |
| Kibana | Log analysis, Elastic ecosystem | Moderate | Logs, traces, security | $95/mo (Elastic Cloud) |
| Netdata | Real-time infrastructure monitoring | Very Easy | System/infra metrics | $3.50/node/mo |
| Signoz | Unified observability (APM) | Moderate | Traces, metrics, logs | Usage-based ($0.3/GB logs) |
| Superset | Data exploration at scale | Hard | SQL databases, warehouses | On request (Preset Cloud) |
Each tool fills a different gap: Metabase for business analytics, Kibana for log-heavy Elastic setups, Netdata for zero-config infrastructure monitoring, Signoz for all-in-one observability, and Superset for advanced data exploration.
Grafana remains an excellent choice for most monitoring setups — especially if you're already using Prometheus or need a flexible dashboard that connects to many data sources. But if your needs lean more toward business intelligence, log analysis, or plug-and-play infrastructure monitoring, one of these alternatives might be a better fit.
Want to run Grafana yourself? Check out our guides:
- Self-hosting Grafana the easy way (deploy in under 2 minutes with Sliplane)
- Self-hosting Grafana on a Hetzner Ubuntu Server (full step-by-step server setup)
Or head to Sliplane and deploy Grafana for €9/month.