Self-hosting Grafana on a Hetzner Ubuntu Server
 Yulei Chen
Want full control over dashboards, metrics, and alerting? By self-hosting Grafana on an Ubuntu server, you keep predictable costs and full ownership of your monitoring data.
Looking for something simpler? If you'd rather skip server management and deploy Grafana in minutes, check out Sliplane—one-click deploy with HTTPS and persistent storage:
Follow along this easy-to-understand guide to learn how you can deploy your own Grafana instance using Docker and Caddy web server for automatic HTTPS.
For this post, we're using an affordable server from Hetzner. Hetzner is known to provide great service at an exceptional price/performance ratio, making it an excellent choice for hosting Grafana.
Prerequisites
Before we start, make sure you have a Hetzner Cloud account (or be ready to create one).
Step 1: Setup Your Hetzner Server
If you don't have a Hetzner server yet, follow these steps to create one:
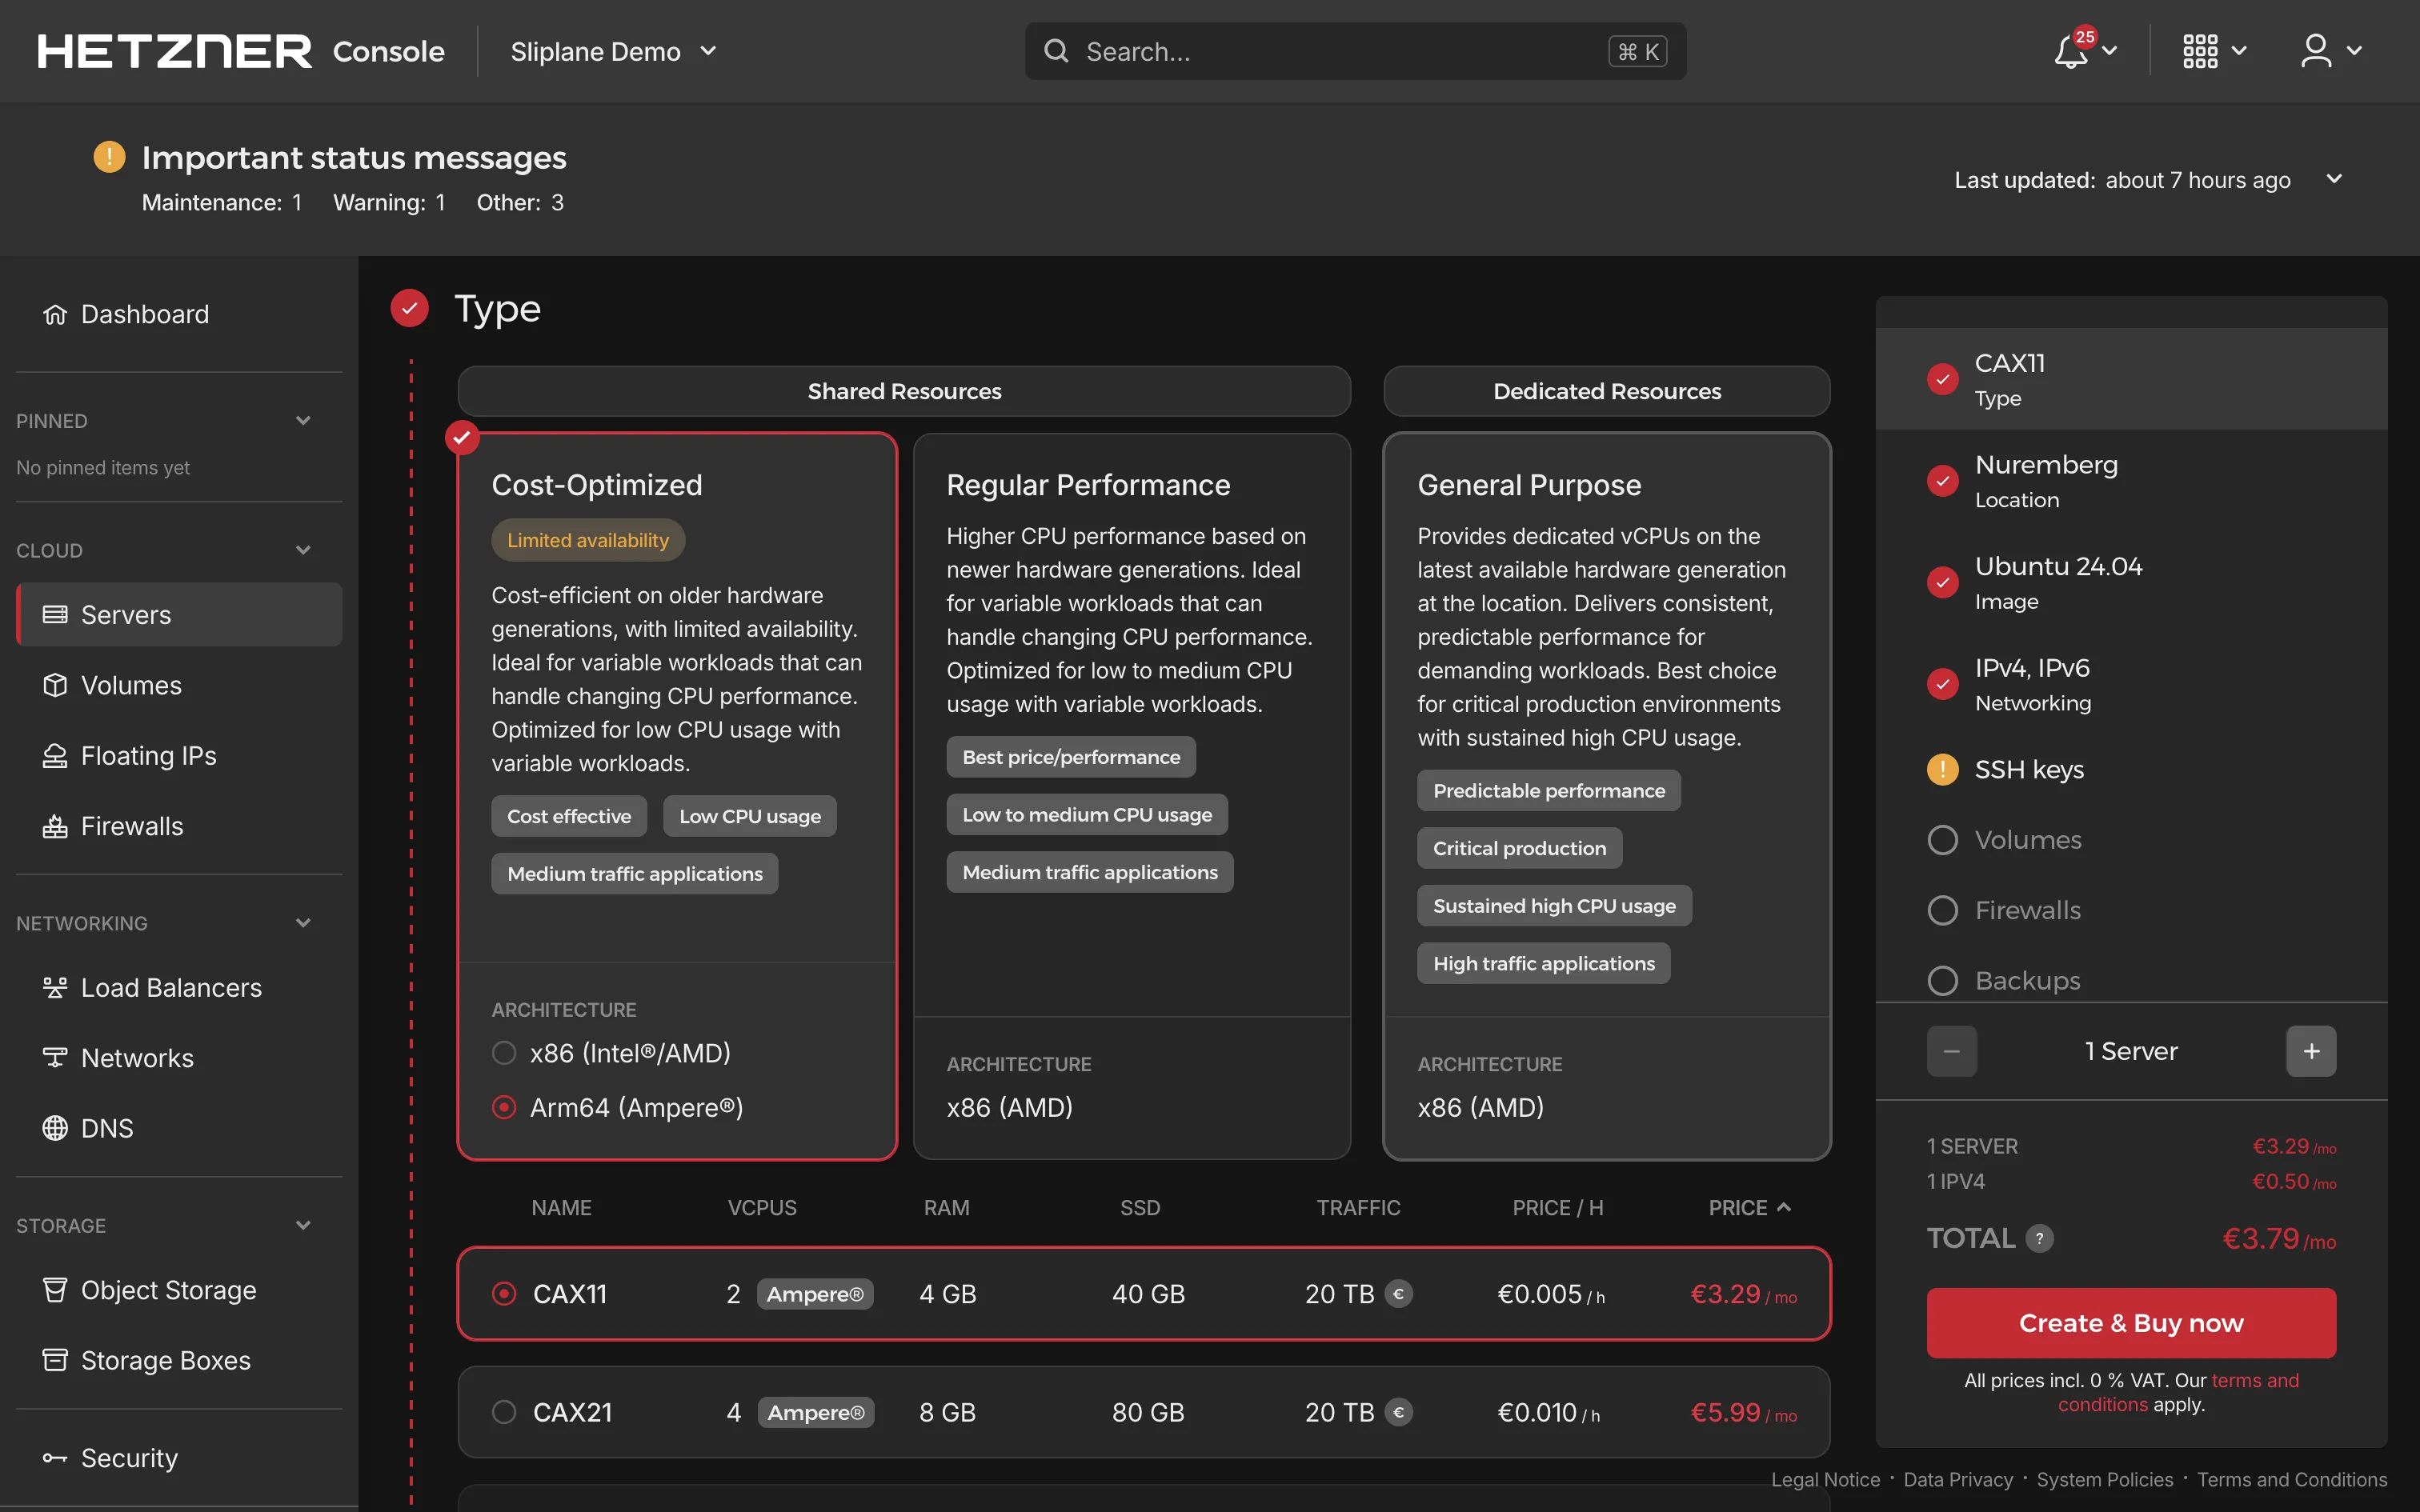
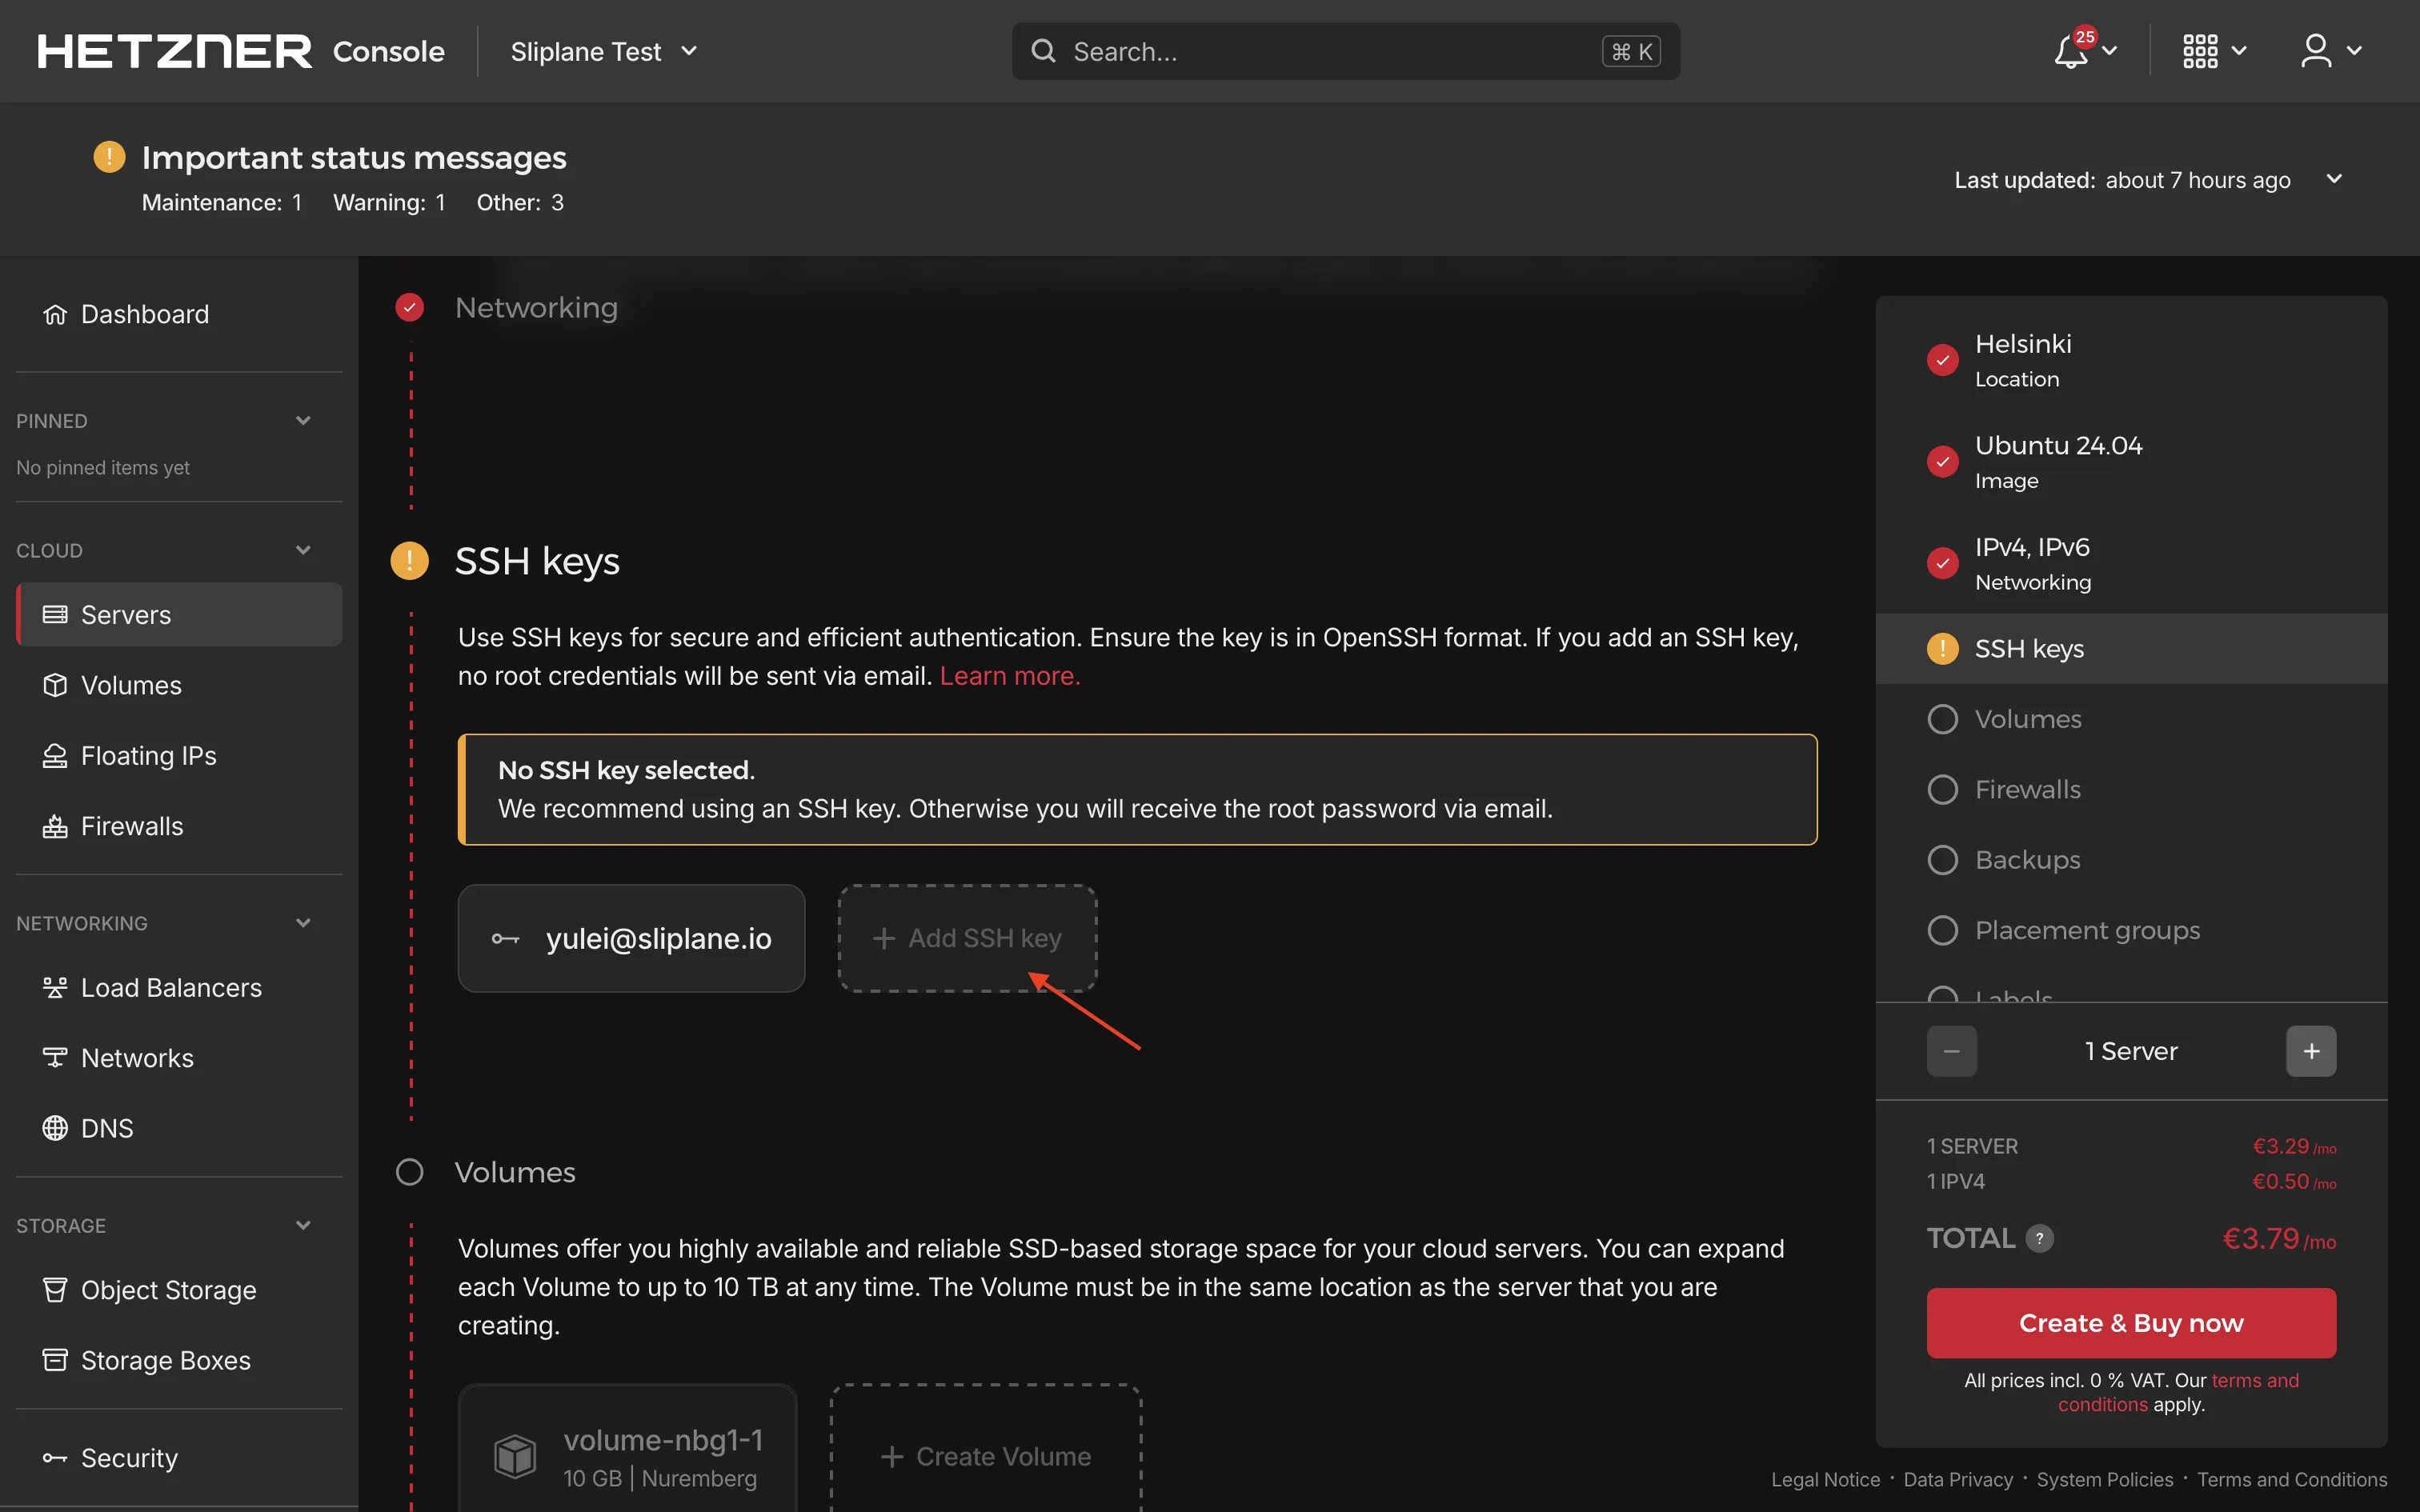
- Go to the Hetzner Cloud Console, choose a project or create a new one, then navigate to Servers → Add Server

- Follow Hetzner's guidelines to choose:
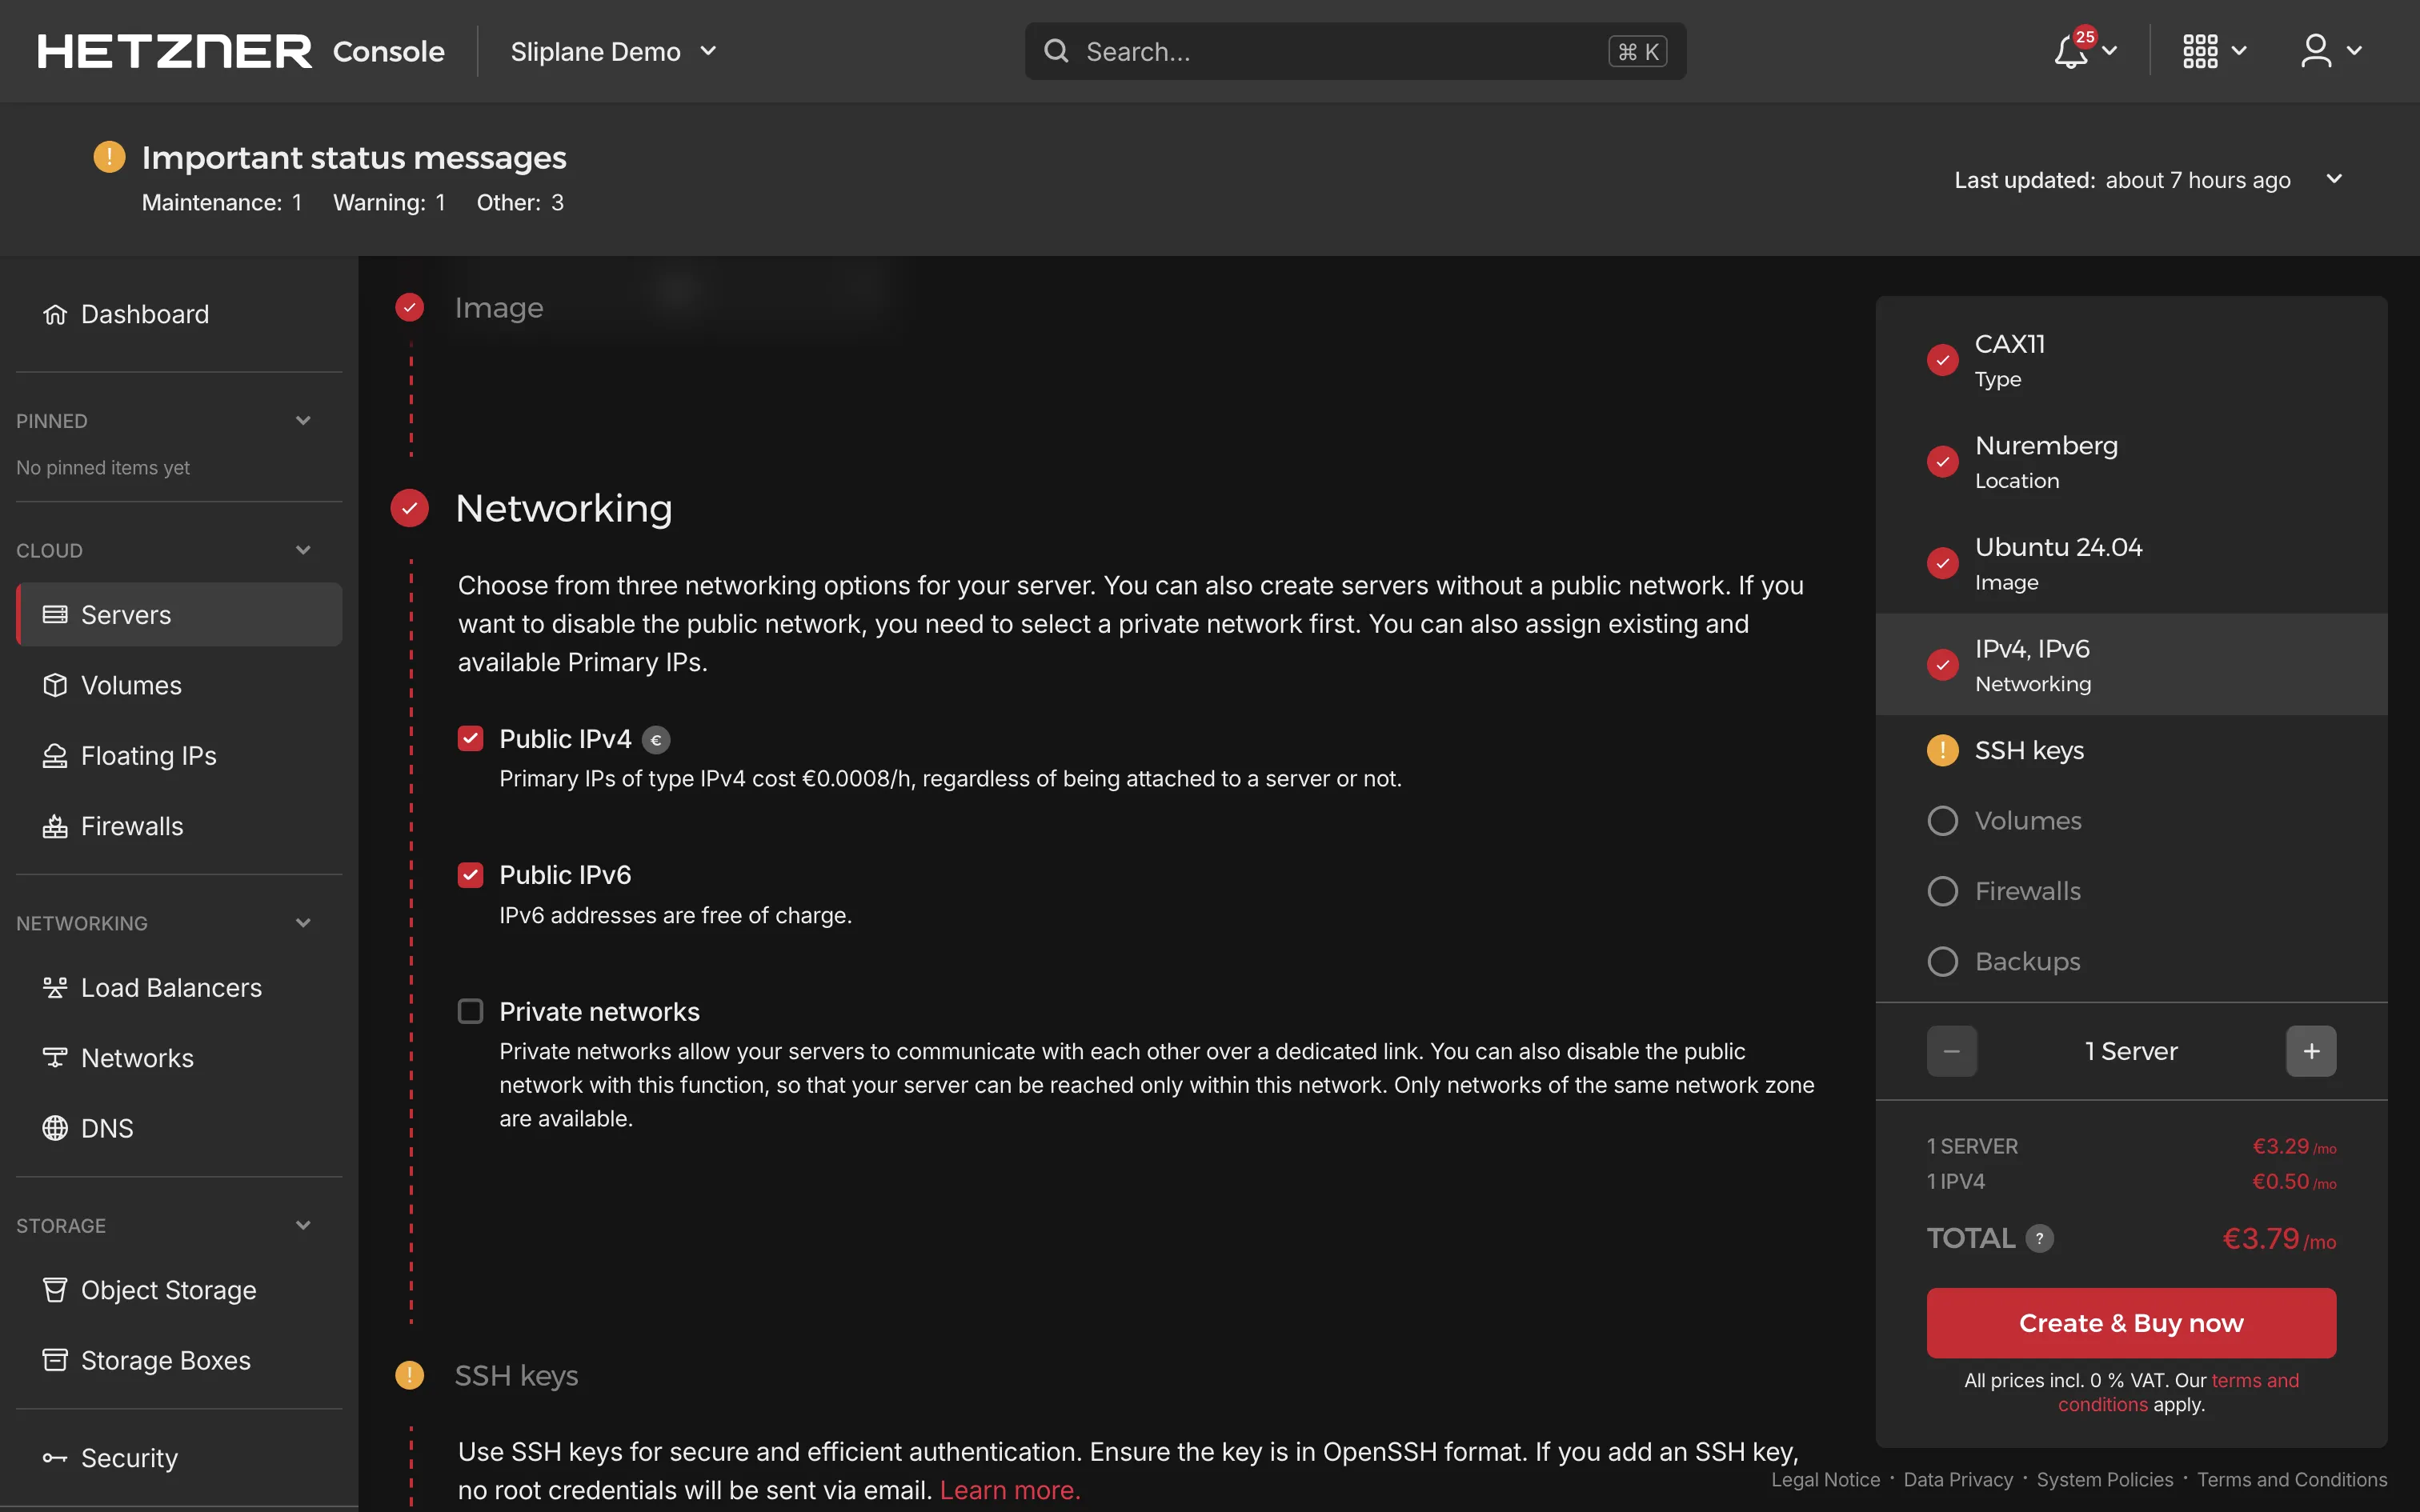
- Server type: Select a server type that fits your needs.
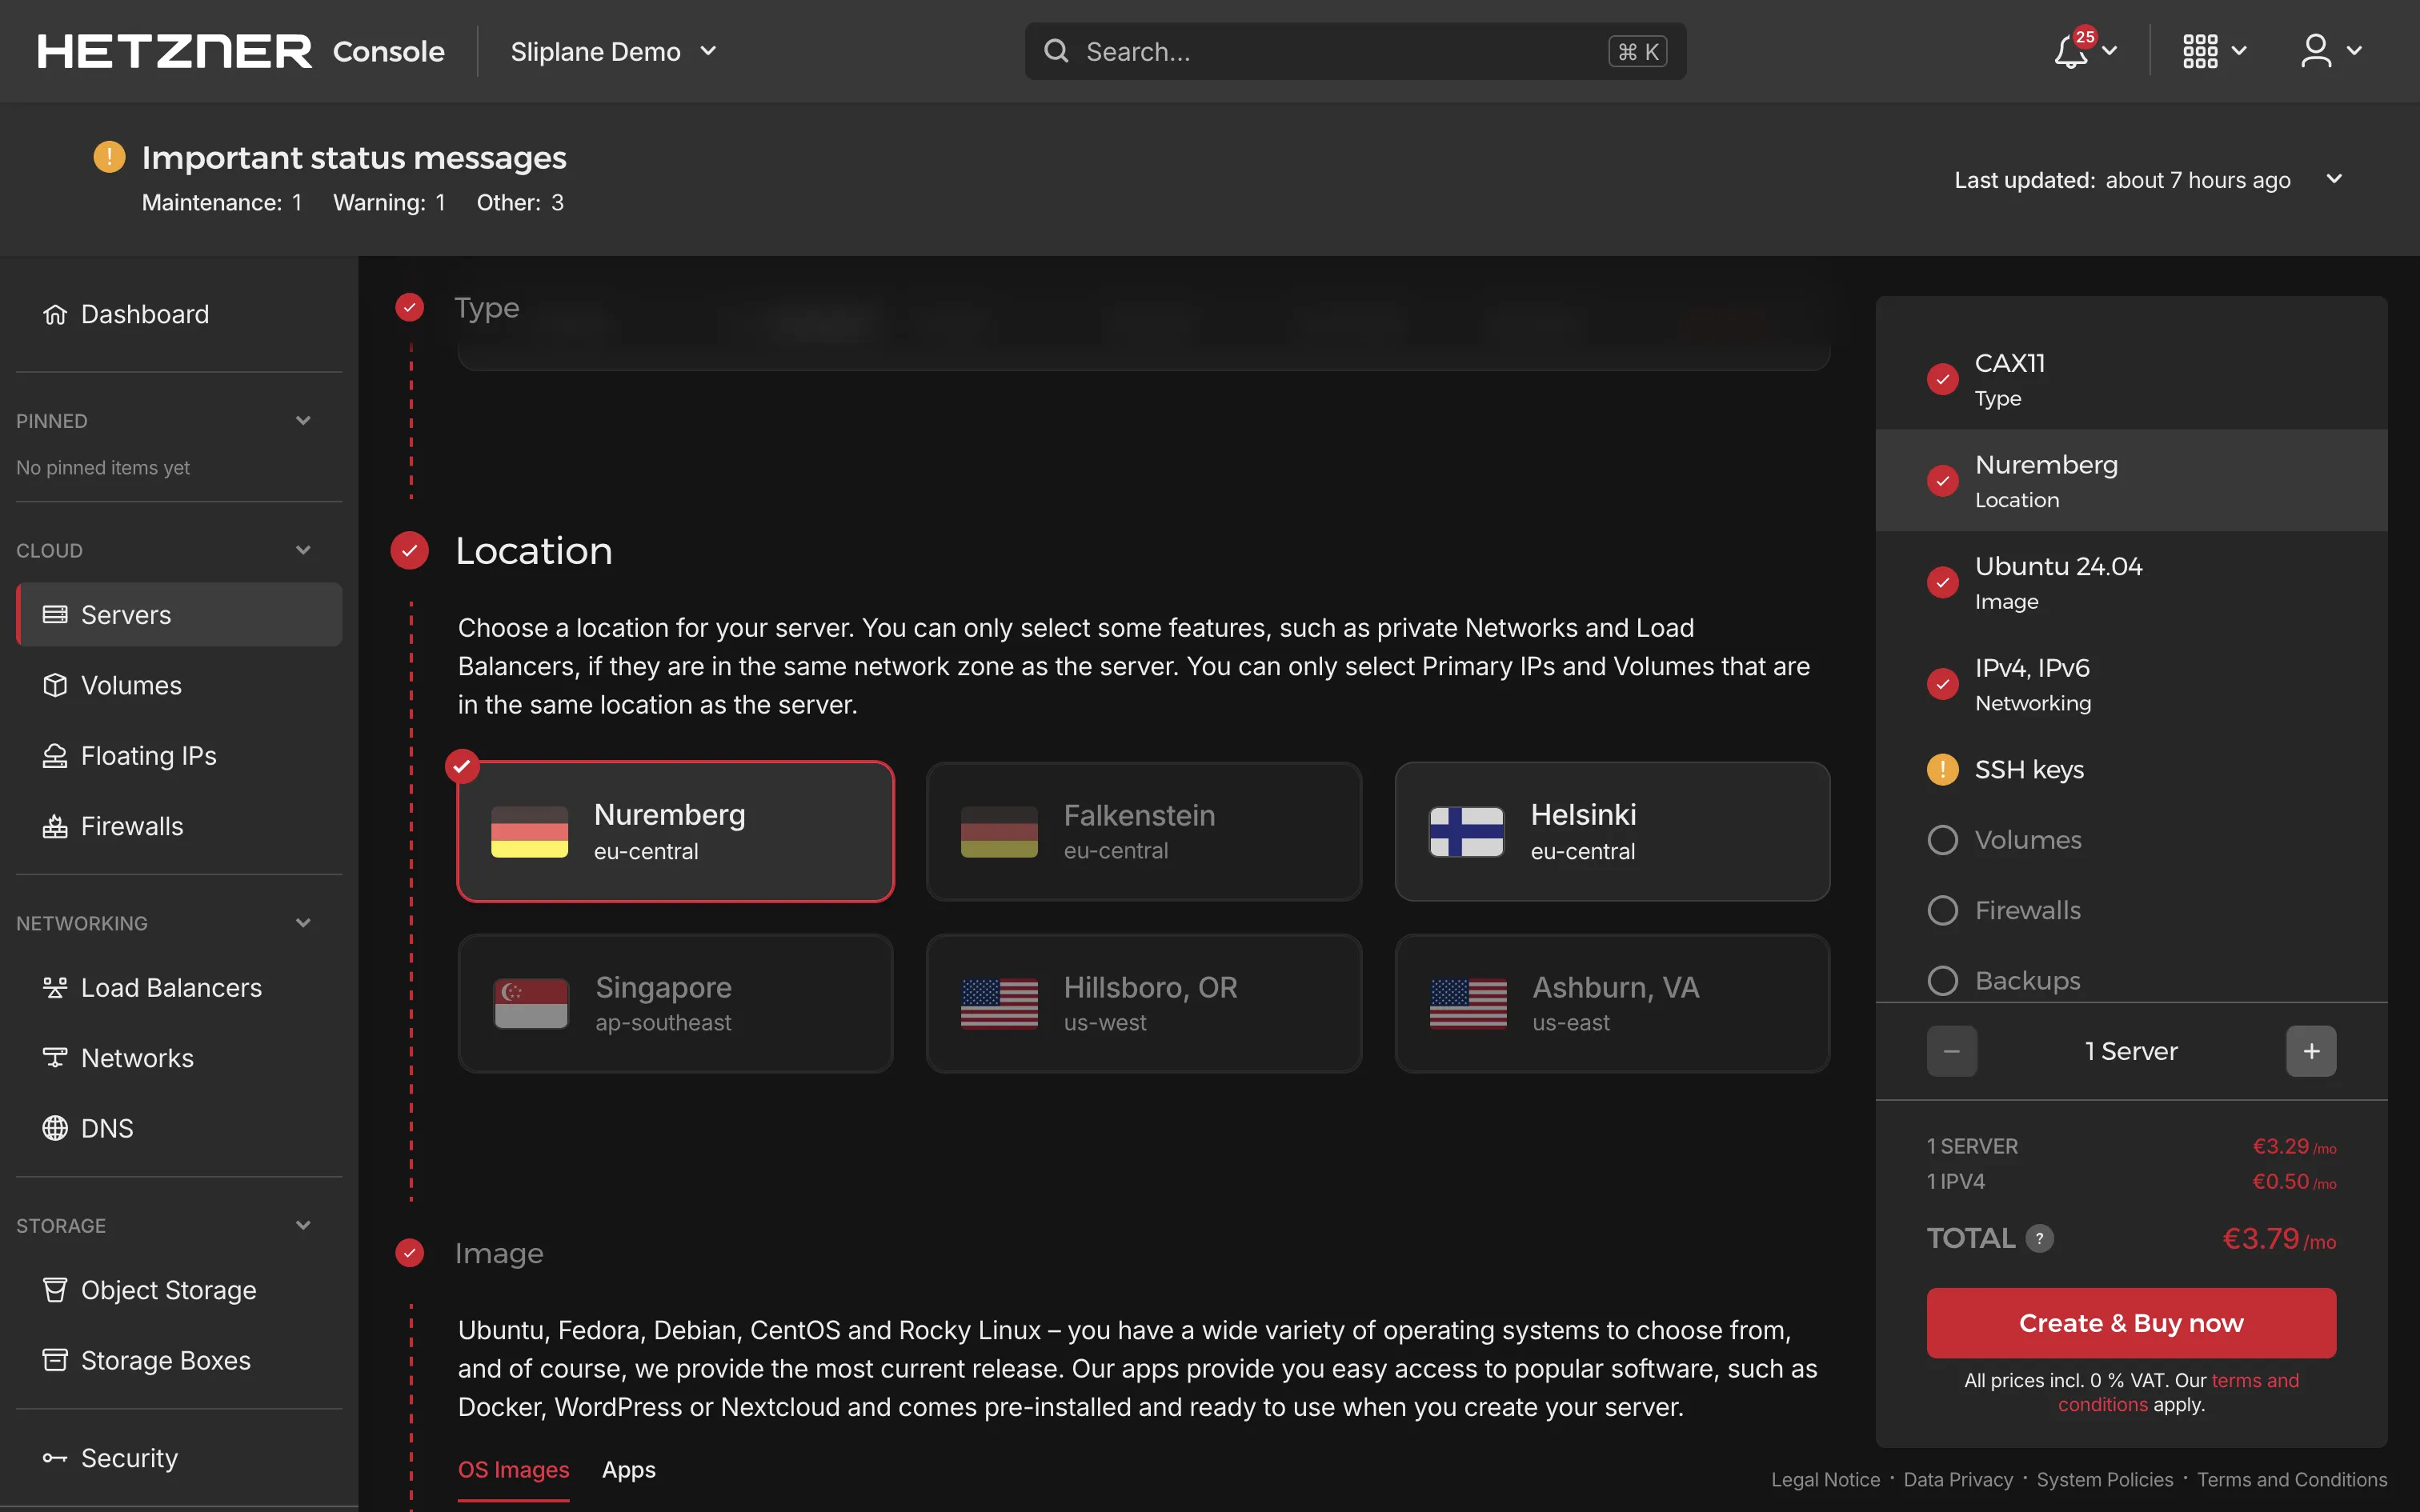
- Location: Choose a data center location closest to you or your users.
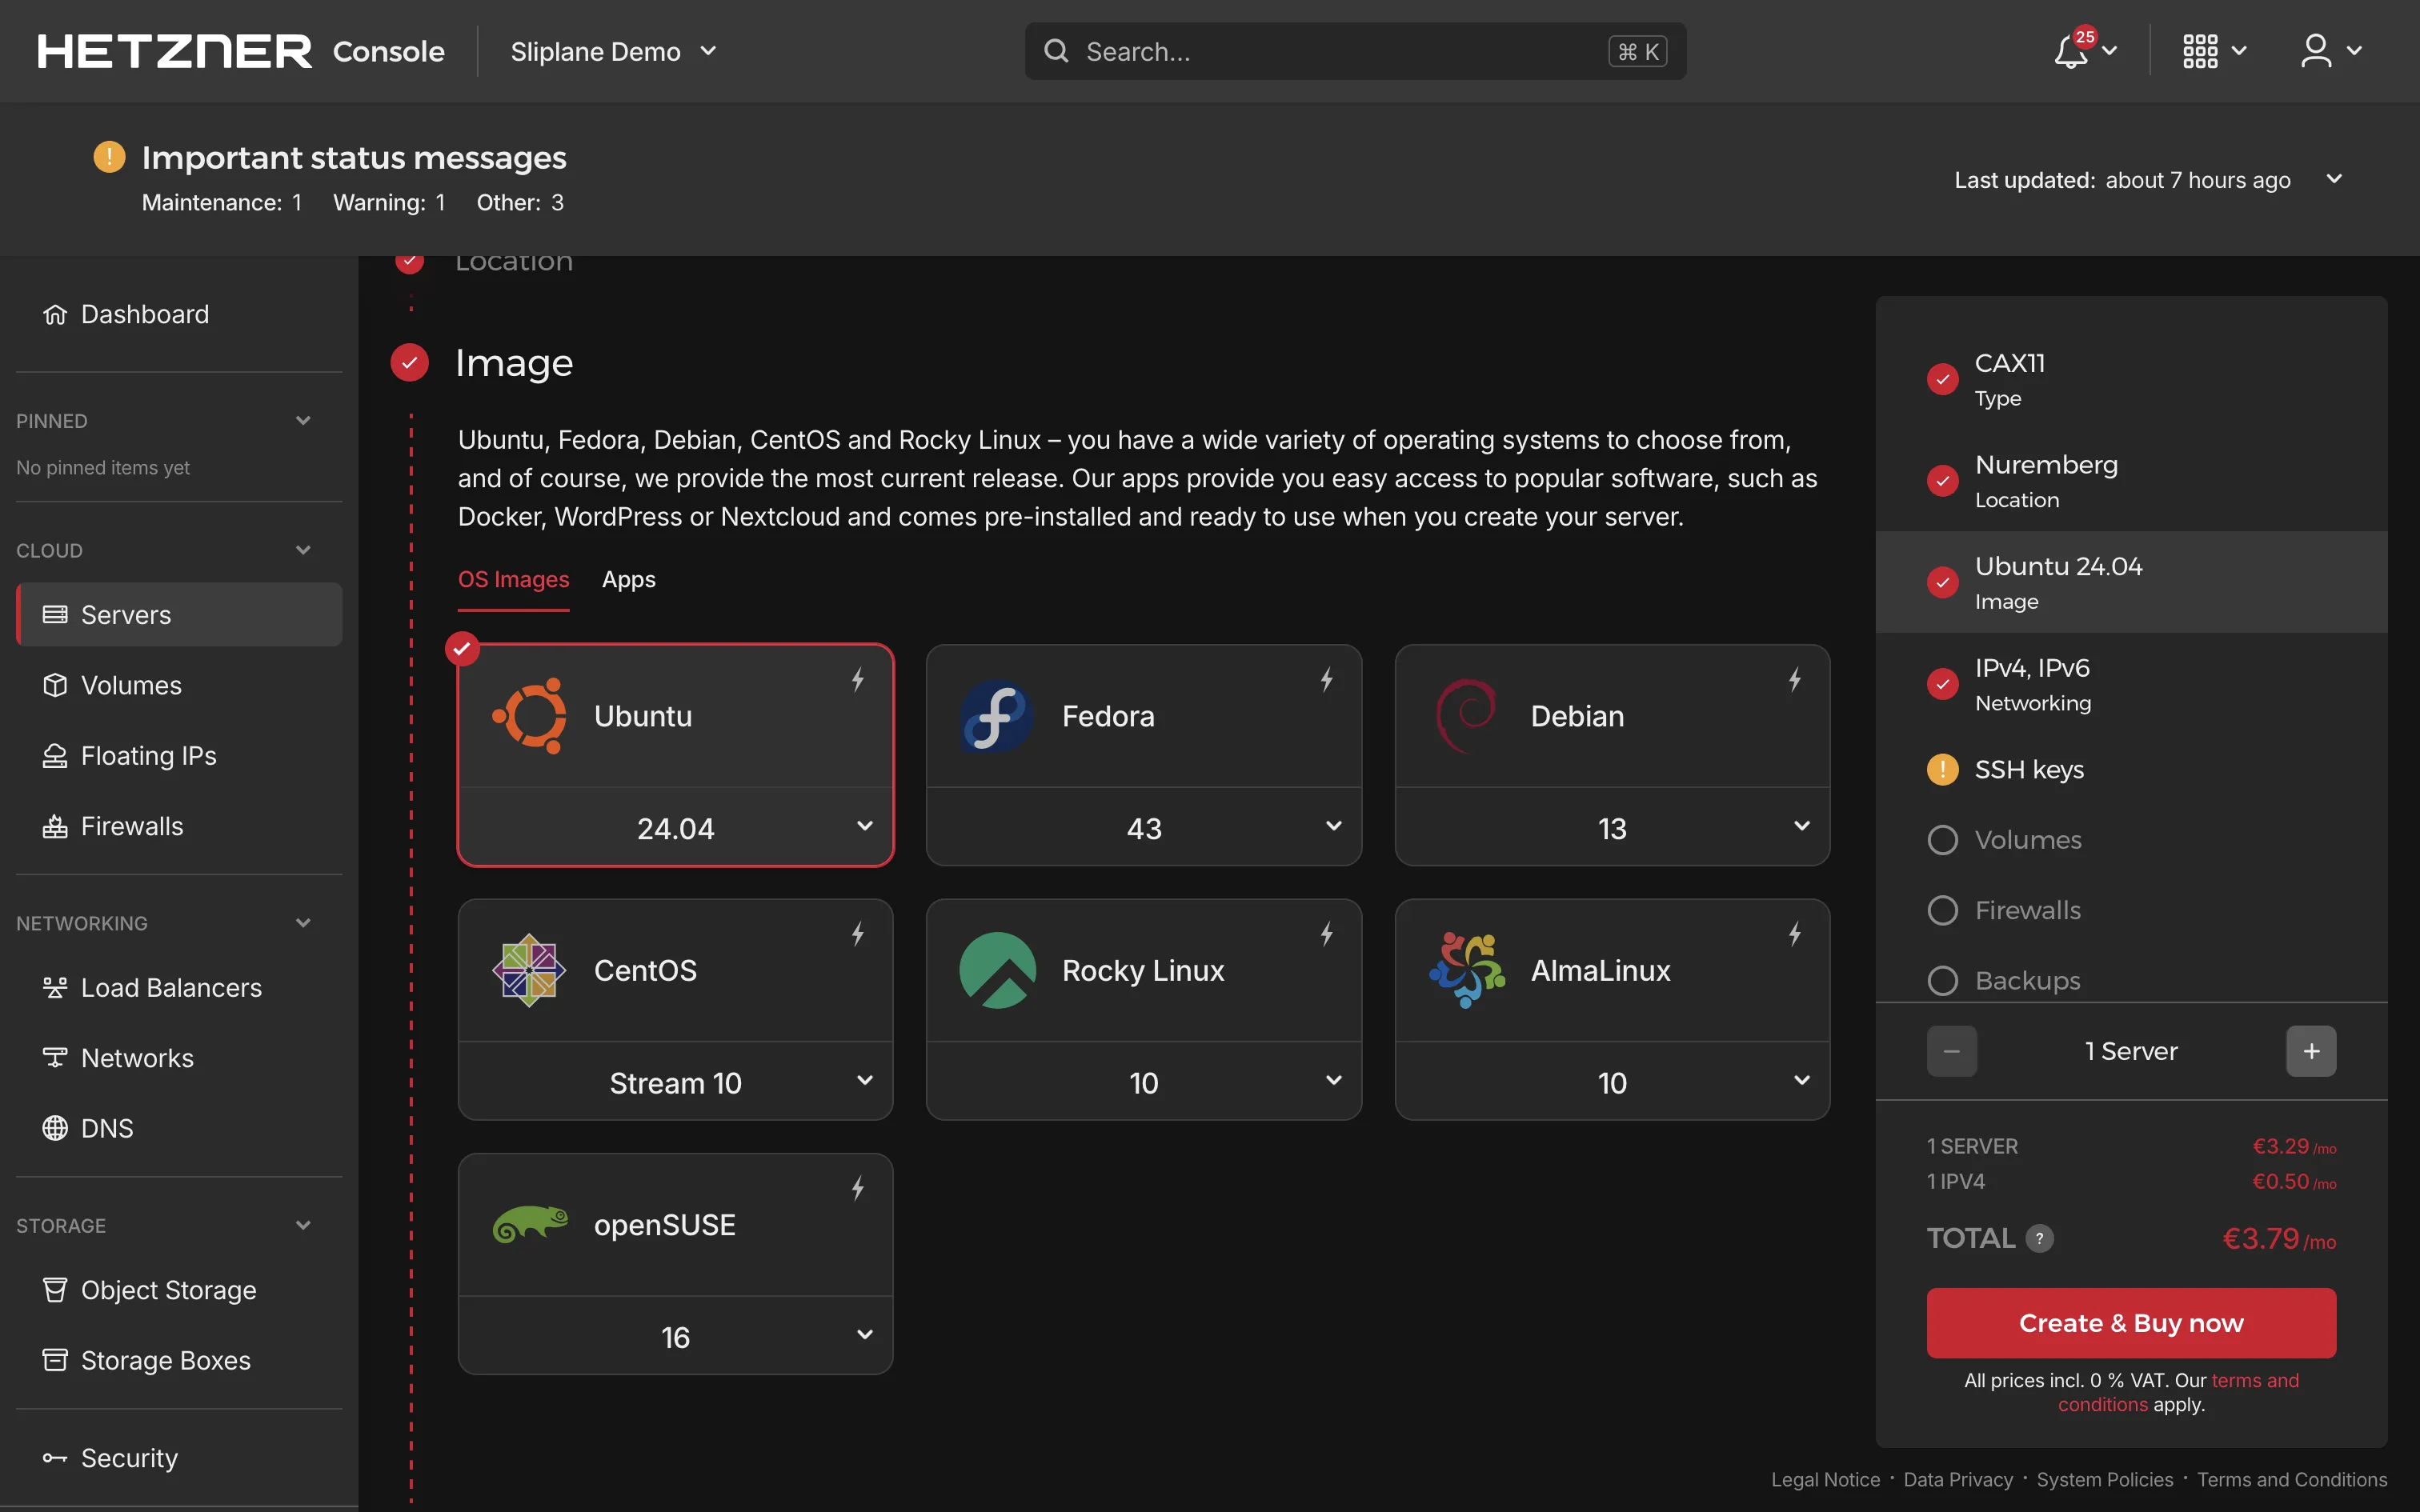
- Image: Select Ubuntu (latest LTS version recommended).
- Add SSH key: Add your SSH public key for secure access. If you don't have an SSH key yet, you can generate one using
ssh-keygen:
ssh-keygen -t ed25519 -C "your_email@example.com"
Check it out with cat ~/.ssh/id_ed25519.pub and paste it into your server.
- Configure networking if needed, then click Create & Pay to provision your server
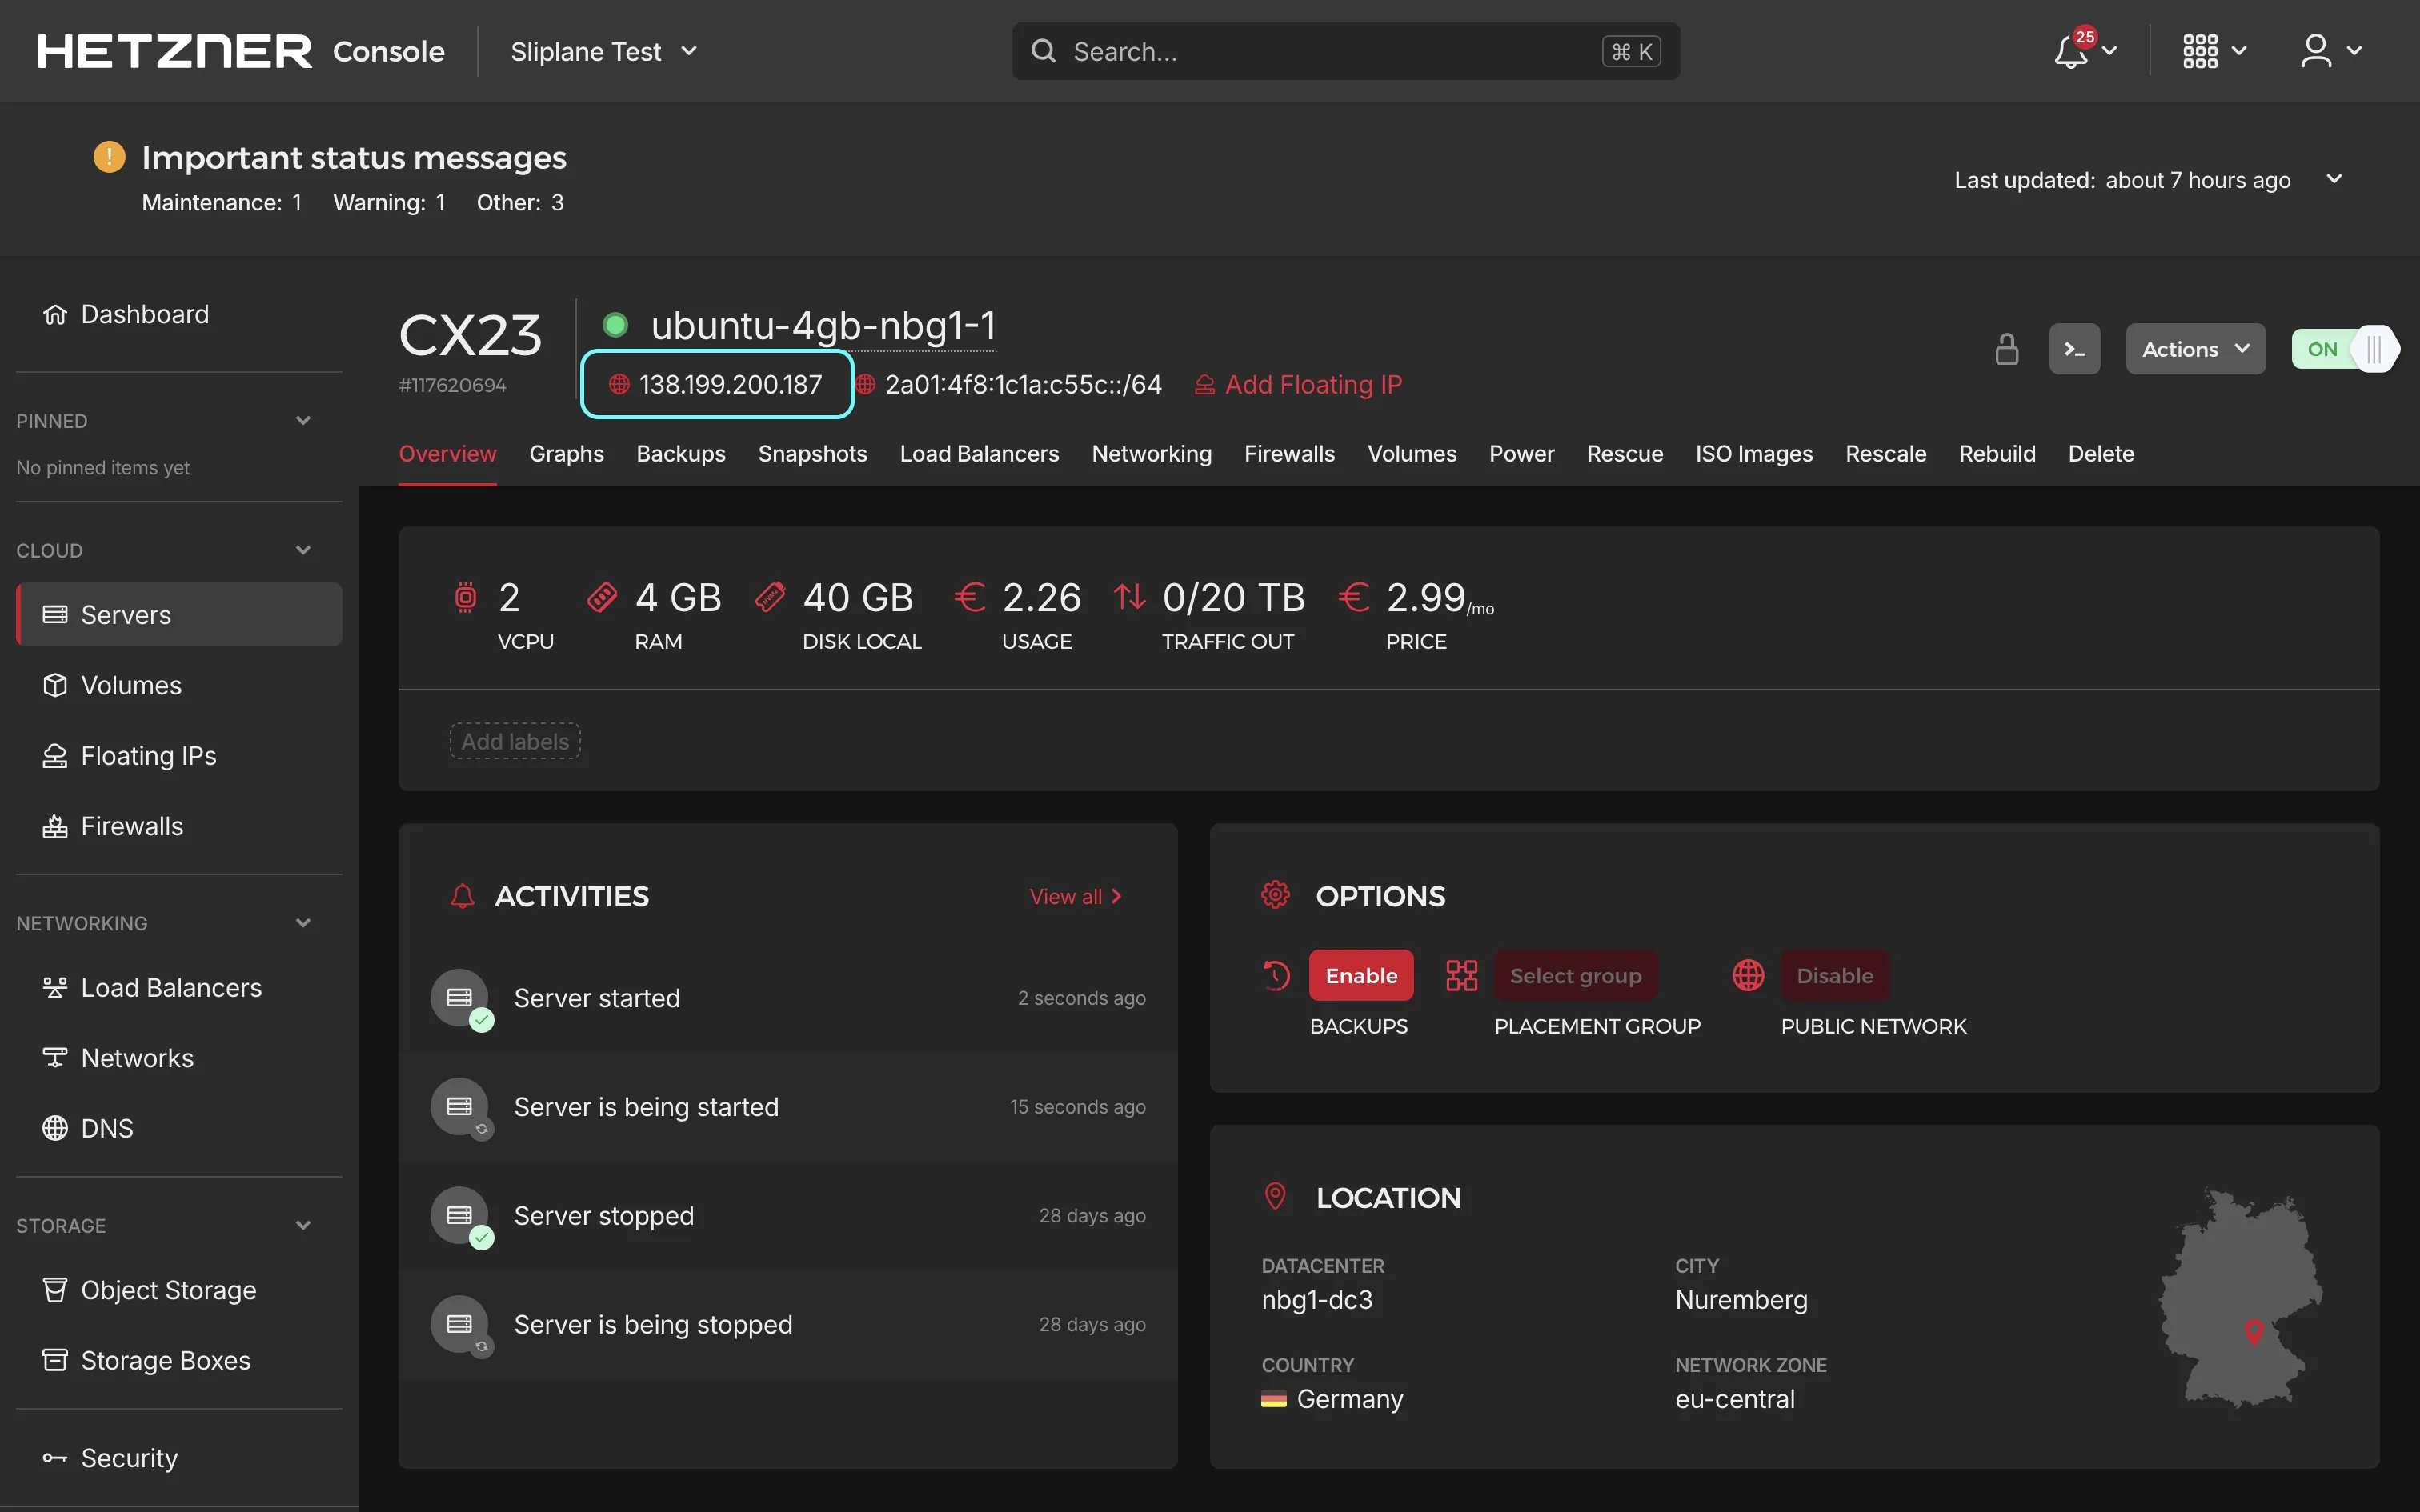
Once your server is created, note down its IP address. You'll use this to connect via SSH in the next step.
Step 2: Update Your Server
Open your terminal and log into your Ubuntu server via SSH:
ssh root@your-server-ip
and update the system to ensure it has the latest security patches and updates:
sudo apt-get update
sudo apt-get upgrade -y
Once finished, your server is ready for installing the software.
Step 3: Install and Configure UFW Firewall
Only keep necessary ports open: SSH (22), HTTP (80), HTTPS (443).
Install UFW and configure the firewall as follows:
sudo apt install ufw -y
sudo ufw allow 22    # SSH
sudo ufw allow 80    # HTTP
sudo ufw allow 443   # HTTPS
sudo ufw enable
Check your firewall configuration:
sudo ufw status verbose
Docker can sometimes ignore UFW rules. To tackle this, verify extra settings as explained here.
Step 4: Docker Installation
Docker will run Grafana in a container. Install Docker by running these commands:
Setup dependencies and Docker's GPG key:
sudo apt-get update
sudo apt-get install ca-certificates curl gnupg

sudo install -m 0755 -d /etc/apt/keyrings
curl -fsSL https://download.docker.com/linux/ubuntu/gpg \
| sudo gpg --dearmor -o /etc/apt/keyrings/docker.gpg
sudo chmod a+r /etc/apt/keyrings/docker.gpg
Add Docker repository:
echo \
  "deb [arch=$(dpkg --print-architecture) \
signed-by=/etc/apt/keyrings/docker.gpg] \
https://download.docker.com/linux/ubuntu \
$(. /etc/os-release && echo $VERSION_CODENAME) stable" \
| sudo tee /etc/apt/sources.list.d/docker.list > /dev/null

sudo apt-get update
Install Docker Engine and compose-plugin:
sudo apt-get install docker-ce docker-ce-cli \
containerd.io docker-buildx-plugin docker-compose-plugin -y
Check installation:
sudo docker run hello-world
If you see the "hello-world" message, Docker is ready.
Step 5: Install Caddy for Automatic HTTPS
Caddy simplifies HTTPS configuration since it handles SSL certificates automatically from Let's Encrypt.
Install Caddy:
sudo apt install -y debian-keyring debian-archive-keyring apt-transport-https curl

curl -1sLf 'https://dl.cloudsmith.io/public/caddy/stable/gpg.key' \
| sudo gpg --dearmor -o /usr/share/keyrings/caddy-stable-archive-keyring.gpg

curl -1sLf 'https://dl.cloudsmith.io/public/caddy/stable/debian.deb.txt' \
| sudo tee /etc/apt/sources.list.d/caddy-stable.list

sudo apt update
sudo apt install caddy -y
Before configuring Caddy, you need to point your domain to your server's IP address. If you haven't configured DNS yet, follow these steps:
Configure DNS for Your Domain
- Log into your domain registrar's dashboard (where you purchased your domain)
- Navigate to the DNS settings or DNS management section
- Add an A record with the following settings:
- Type:
A - Name:
@(for root domain) or a subdomain likegrafana(forgrafana.yourdomain.com) - Value/Target: Your Hetzner server's IPv4 address
- Type:
- Add an AAAA record for IPv6 support:
- Type:
AAAA - Name:
@(for root domain) or the same subdomain you used for the A record - Value/Target: Your Hetzner server's IPv6 address
- Type:
DNS changes can take a few minutes to several hours to propagate. You can check if your DNS is configured correctly using tools like dig or online DNS checkers. Once the DNS record is active, you can proceed with Caddy configuration.
Configure Caddy
Edit the Caddyfile configuration file:
sudo nano /etc/caddy/Caddyfile
Enter your domain and configure reverse proxy. Replace "yourdomain.com" with your actual domain name:
yourdomain.com {
    reverse_proxy localhost:3000
}
If no domain yet, use this temporarily:
:80 {
    reverse_proxy localhost:3000
}
Restart Caddy to load the config:
sudo systemctl restart caddy
Step 6: Run Grafana with Docker Compose
We're going to use Docker Compose for easier setup.
First create a directory for Grafana, then navigate to it and create the compose file:
mkdir -p ~/grafana
cd ~/grafana
sudo nano compose.yml
Copy/paste the following content into compose.yml:
services:
  grafana:
    image: grafana/grafana:12.4.0-ubuntu
    container_name: grafana
    restart: unless-stopped
    ports:
      - "3000:3000"
    volumes:
      - "grafana_storage:/var/lib/grafana"

volumes:
  grafana_storage: {}
If you want the Enterprise edition instead, change the image to grafana/grafana-enterprise:<version>-ubuntu. See Configure a Grafana Docker image for more details.
Start Grafana:
sudo docker compose up -d
Docker pulls the Grafana image and runs it in background mode using port 3000.
Step 7: Access Your Self-Hosted Grafana Instance
Your Grafana instance should now load successfully at https://yourdomain.com. If you're using a temporary HTTP setup, open http://your-server-ip:3000.
Grafana's default login is:
- Username:
admin - Password:
admin
You'll be prompted to change the password on first login. Set a strong password and store it securely.
Security Recommendations
Public servers should always be secure. The following practises are recommended:
- Regularly apply updates and security patches.
- Set strong passwords and control user access.
- Monitor server logs for suspicious activity.
- Install tools like Fail2ban for extra security.
Updating Your Grafana Installation
When you want to update your Grafana instance, first check the latest version on Docker Hub, then update the image version in your compose.yml file and run:
cd ~/grafana
sudo docker compose pull
sudo docker compose up -d
Docker will download updated versions automatically and replace your current containers.
Cost Comparison with Other Providers
Self-hosting Grafana typically results in lower costs compared to hosted dashboards:
| Provider | vCPU Cores | RAM | Disk | Estimated Monthly Cost | Notes |
|---|---|---|---|---|---|
| Sliplane | 2 | 2 GB | 40 GB | €9 | charge per server |
| Render | 1 | 2 GB | 40 GB | ~$35–$45 | VM Small |
| Fly.io | 2 | 2 GB | 40 GB | ~$20–$25 | VM + volume |
| Railway | 2 | 2 GB | 40 GB | ~$15–$66 | Usage-based |
Conclusion
You now have a self-hosted Grafana instance on Hetzner with Docker and HTTPS. If you want less maintenance and faster setup, Sliplane gets you there in minutes without the server overhead.