How We Cut Our Observability Bill 20x by Self-Hosting
 Jonas Scholz
Sliplane sits in a pretty important place in our customers' stack.
We are a PaaS. If we break, their app might be down. If we are slow, their deploys are slow. If our API returns a 500, that is not just a funny little error in our logs, it might block someone from shipping!
That is always serious, but gets more important the more you grow. A 1/100 error is suddenly a 10/100 error and gets much more noticeable.
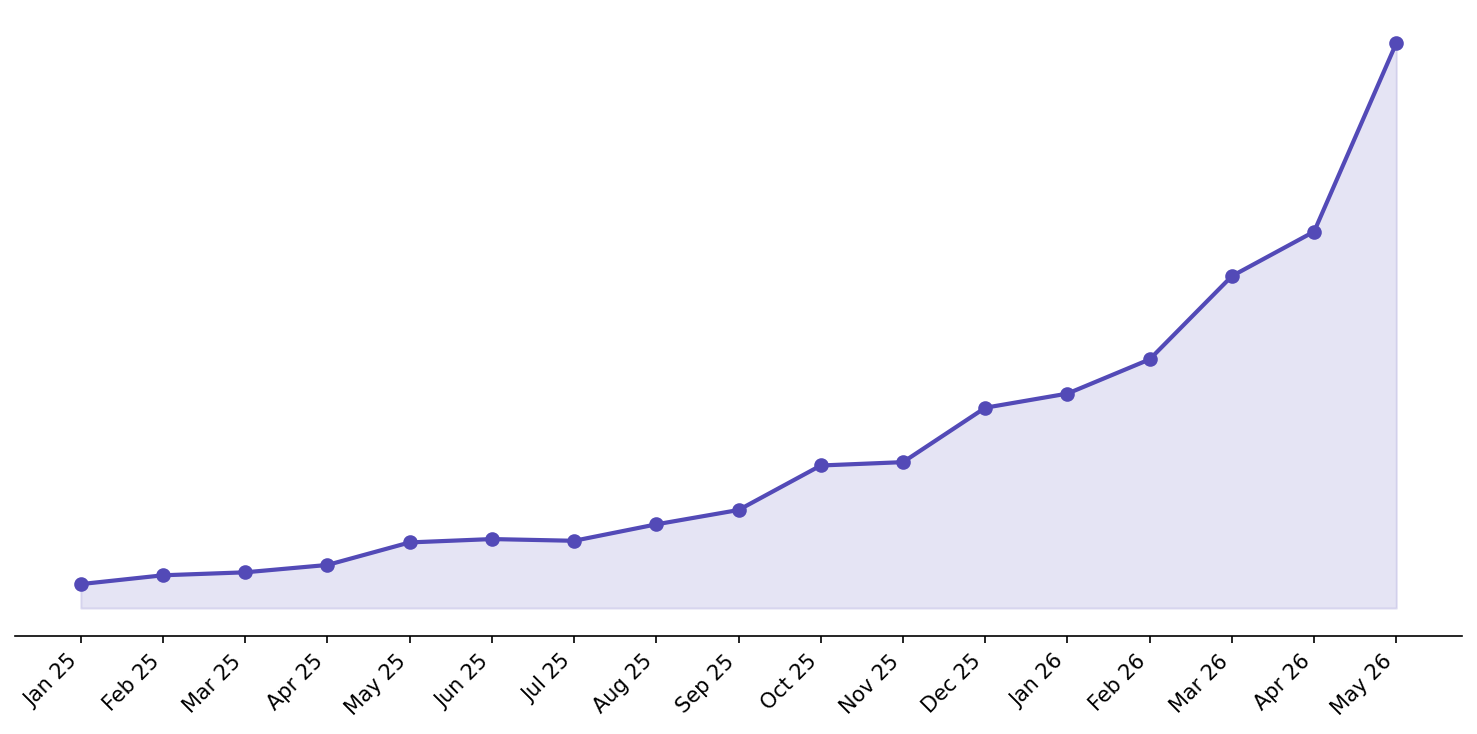
Between January and May, our user activity more than tripled. Over the last year, we scaled much more than that. I already wrote about some of the stack changes in Tech Stack Lessons from scaling 20x, but the biggest operational change since then has been observability.
So around January, we started investing much more into observability. For us, that mostly meant three things:
- Metrics that tell us quickly when something is off
- Traces that show where a request failed
- Logs for the cases where traces and metrics are not enough
Traces became the most important part pretty quickly. It is one thing to know that an API request failed with a 500. It is much more useful to know which downstream call failed, how long every step took, and which service produced the error. Once we had that for requests moving across multiple systems, a lot of bugs became much easier to fix.
Logs are still useful, but they stopped being the first thing we reach for. When tracing works well, logs become more of a fallback than the main debugging tool.
The Problem: Observability Gets Expensive Fast
The obvious but annoying part is that the better your observability gets, the more data you create. Every extra trace, span, metric, log line, label, and attribute makes debugging nicer, but it also increases the amount of data you have to ingest, store, and query.
We started with Axiom for logs. Axiom is a good product, but our costs exploded. Even before we went really deep on tracing and metrics, we were already looking at something like $1,000/month. That was not an option for us :D.
So we moved to Parseable, which is an open source Axiom alternative. At first, it worked. The team was genuinely helpful, and I appreciate how much they helped us get set up. But for our use case, we started running into scaling (?) issues. Debugging those issues was hard, and performance was not where we needed it to be. That does not mean Parseable is bad. It just did not work out for us.
Then we looked at Grafana Cloud for the full setup, but the pricing did not make sense for us. Based on our current Loki, Tempo, and Prometheus usage, sending all of that data to Grafana Cloud would cost us roughly $25,000/year.
That is probably fine for a larger company. For us, it is not.
The Setup We Ended Up With
So now we self-host the boring parts:
- Loki for logs
- Tempo for traces
- Prometheus for metrics
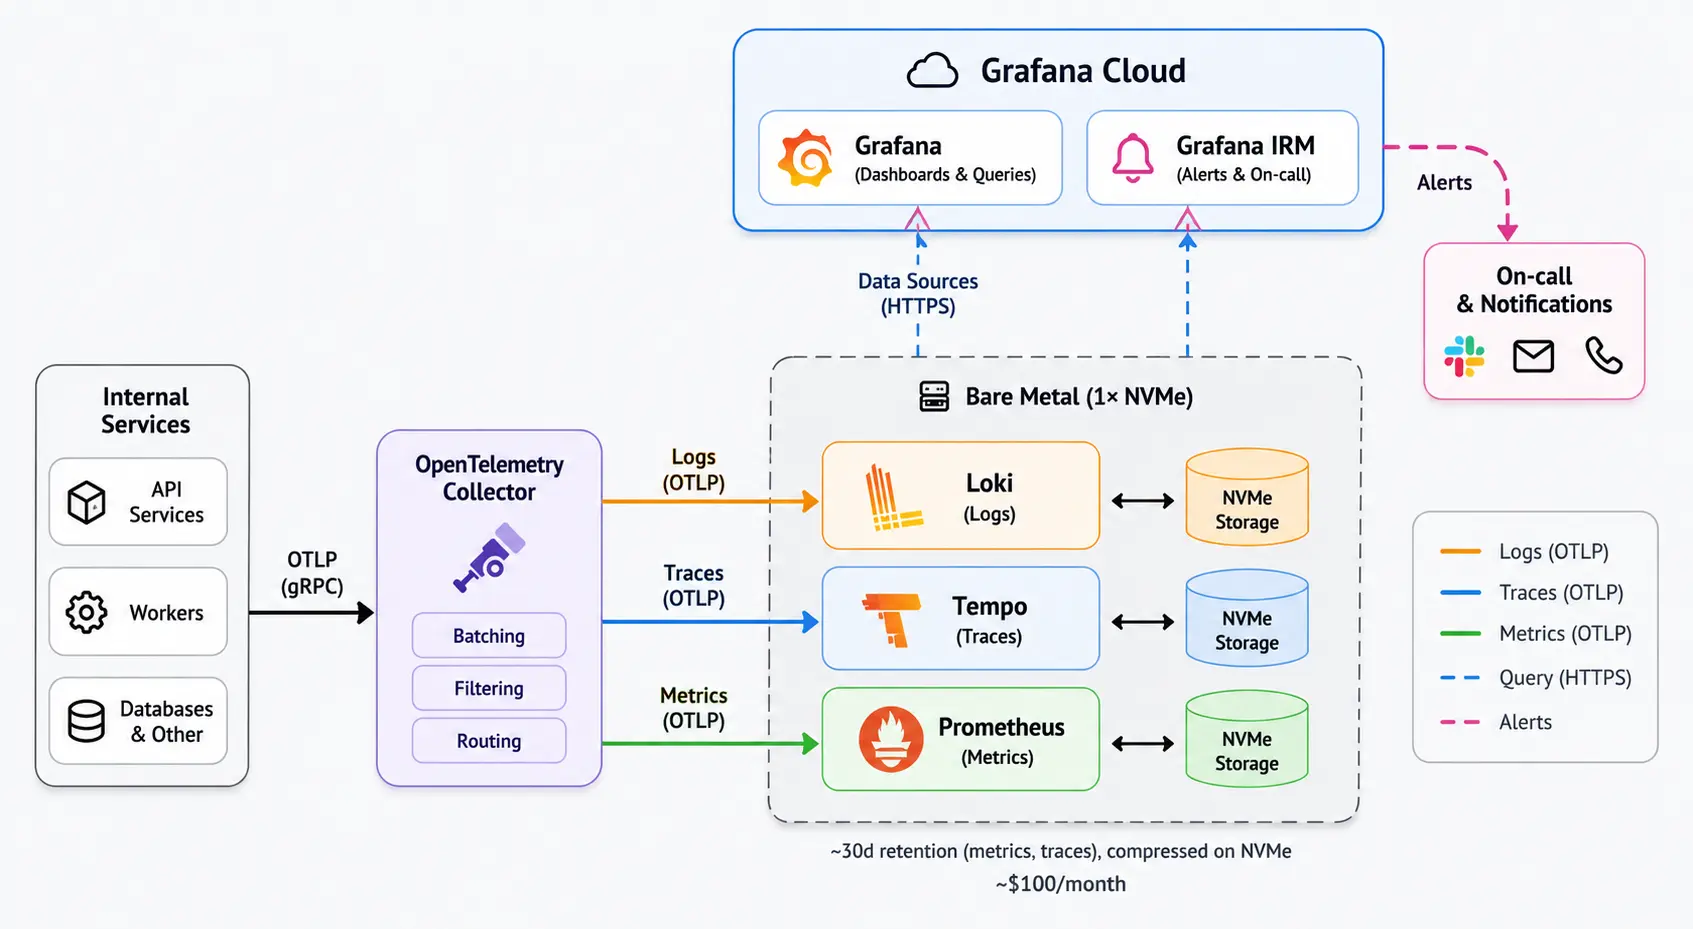
And we still use Grafana Cloud, but only for the parts where it actually makes sense for us. Grafana Cloud does not store our observability data. It just connects to our own self-hosted data sources and visualizes them. Dashboards, panels, queries, all the nice Grafana stuff, without paying hosted-ingestion prices for every single span and log line.
We also use Grafana IRM for on-call schedules and alerts, which is great and exactly the kind of thing I do not want to self-host. I am very happy to pay for alert routing, escalation policies, and on-call schedules. I am much less happy to pay hosted ingestion prices for every internal trace and log line we produce.
The actual data lives on one bare-metal machine with NVMe disks. There is no Kubernetes cluster, no object storage backend, and no fancy multi-region observability lake. Just Loki, Tempo, Prometheus, fast local disks, and enough retention for what we need.
The collectors batch data, smooth out ingestion a bit, and give us one central place to control where telemetry goes. Once the services emit traces in a standard way, the backend becomes much easier to swap out. Axiom, Parseable, Tempo, Grafana Cloud, something else later; the app instrumentation does not need to care as much.
Right now, that means about 30 days for metrics and traces. Storage has not been a problem. The data compresses really well, and our scale is not insane. We are doing a few thousand spans per second, ingesting a few terabytes of logs, and tracking around 200,000 metrics. That is real enough to matter, but not "we need a dedicated observability team" scale.
Hosted products get expensive at this point. A single NVMe box does not. Our current setup costs around $100/month.
The Tradeoff
Of course this is a tradeoff. If that machine dies, our internal observability is sad for a while (realistically <15 minutes, replicating this setup is ridiculously simple and mostly automated).
The important part is that this is only internal observability. This setup does not store customer logs. It does not store customer metrics. It does not sit in the critical path of customer workloads. It is for our own traces, metrics, and logs.
If we lose an hour of internal traces, that sucks. But it is not a customer data loss incident. It is not a production outage by itself. It just means we have less visibility for that window, which makes the tradeoff much easier.
For a customer-facing database, I would not make the same decision.
The upside is that we no longer hesitate before adding more traces. That matters more than it sounds. If every new span makes you think about your SaaS bill, you start collecting less data. You sample too aggressively. You skip useful attributes. You avoid adding logs in places where they would help.
Would I Recommend This?
As always, it depends 🙃. The lesson here is not "everyone should self-host observability." Infrastructure choices are only good or bad in context.
Every hour you spend operating observability infrastructure is an hour you are not spending on your product. If the bill is fine, pay it. Hosted observability is useful because it removes a bunch of annoying work.
But if the bill is stopping you from collecting the data you need, self-hosting becomes interesting. The Grafana bill was not just "expensive." It would have changed our behavior. It would have made us add less tracing, fewer logs, fewer metrics, and less context.
For us, that is a bad deal. We need to debug fast. We need to understand failures across services. We need to spot regressions before customers tell us something broke.
So we made the boring, pragmatic choice: put the data on a cheap bare-metal box and keep Grafana Cloud for the part we actually wanted from Grafana Cloud, the visualization, the alerts, the on-call schedules.
For us, spending roughly $25,000/year on hosted observability did not make sense. Spending around $100/month on a simple self-hosted setup did. We probably reduced availability a bit, but we also increased our ability to debug our shit and build a better platform. That is a tradeoff I will take every day of the week :)
As we grow, this setup will change again. Maybe we will add object storage, split things across machines, or eventually pay for hosted observability because the money-to-time equation changes. But right now, this setup gives us the thing we actually need: freedom to observe more, not less, while we try to scale Sliplane another 20x.
Cheers,
Jonas, Co-Founder sliplane.io